Data Science & Data Discovery Platforms Compared. Datameer and Dataiku DSS go head to head.
Overview
We recently performed an evaluation of various data science and data discovery platforms for one of our clients. We looked in detail at Dataiku Data Science Studio (DSS) and Datameer, but also did a high level evaluation of similar tools from Trifecta, Platfora, Alteryx, and others. This post focuses on a comparison of Datameer and Dataiku DSS. We discarded the other tools either on account of their license model or on a high level comparison of their feature set. Below is a summary of the evaluation criteria we used and of course our findings. We found that DSS had a clear edge in the data science department but also had advantages in other areas.
So here is the breakdown of the Datameer versus Dataiku DSS clash (We compared Datameer V 5.7 against Dataiku DSS V2.2).
Table of Contents
Connectivity and Data Ingestion
Both tools are very connector rich. They connect to all major data sources (RDBMS, XML, JSON, Apache web logs, S3, Elasticsearch etc.). You can connect to web service APIs such as Twitter, GitHub etc. Connections are bi-directional. Finally, if you can’t find a connector for your data source you can write your own plugins to connect to other data sources. Both tools also have a marketplace for connectors.
[big_data_promotion]
Architecture
Both DSS and Datameer ship with an external application server that comes with an in-memory engine and connects into various data sources such as Hadoop, RDBMS, NoSQL, File System, Web Services etc.
Self-service Analytics
Self-service analytics allows non-technical data lab members to apply complex transformations to (raw) data through a GUI without coding, programming, or ETL skills. All of the tools follow a similar approach in that they offer an Excel like worksheet to apply transformations to the data. You first extract a (statistically significant) sample of data and then load this sample into memory and apply transformations. Once you are happy you schedule and deploy the transformation script you have defined on the sample to be pushed down into the execution engine (see the point execution engines below for more details).

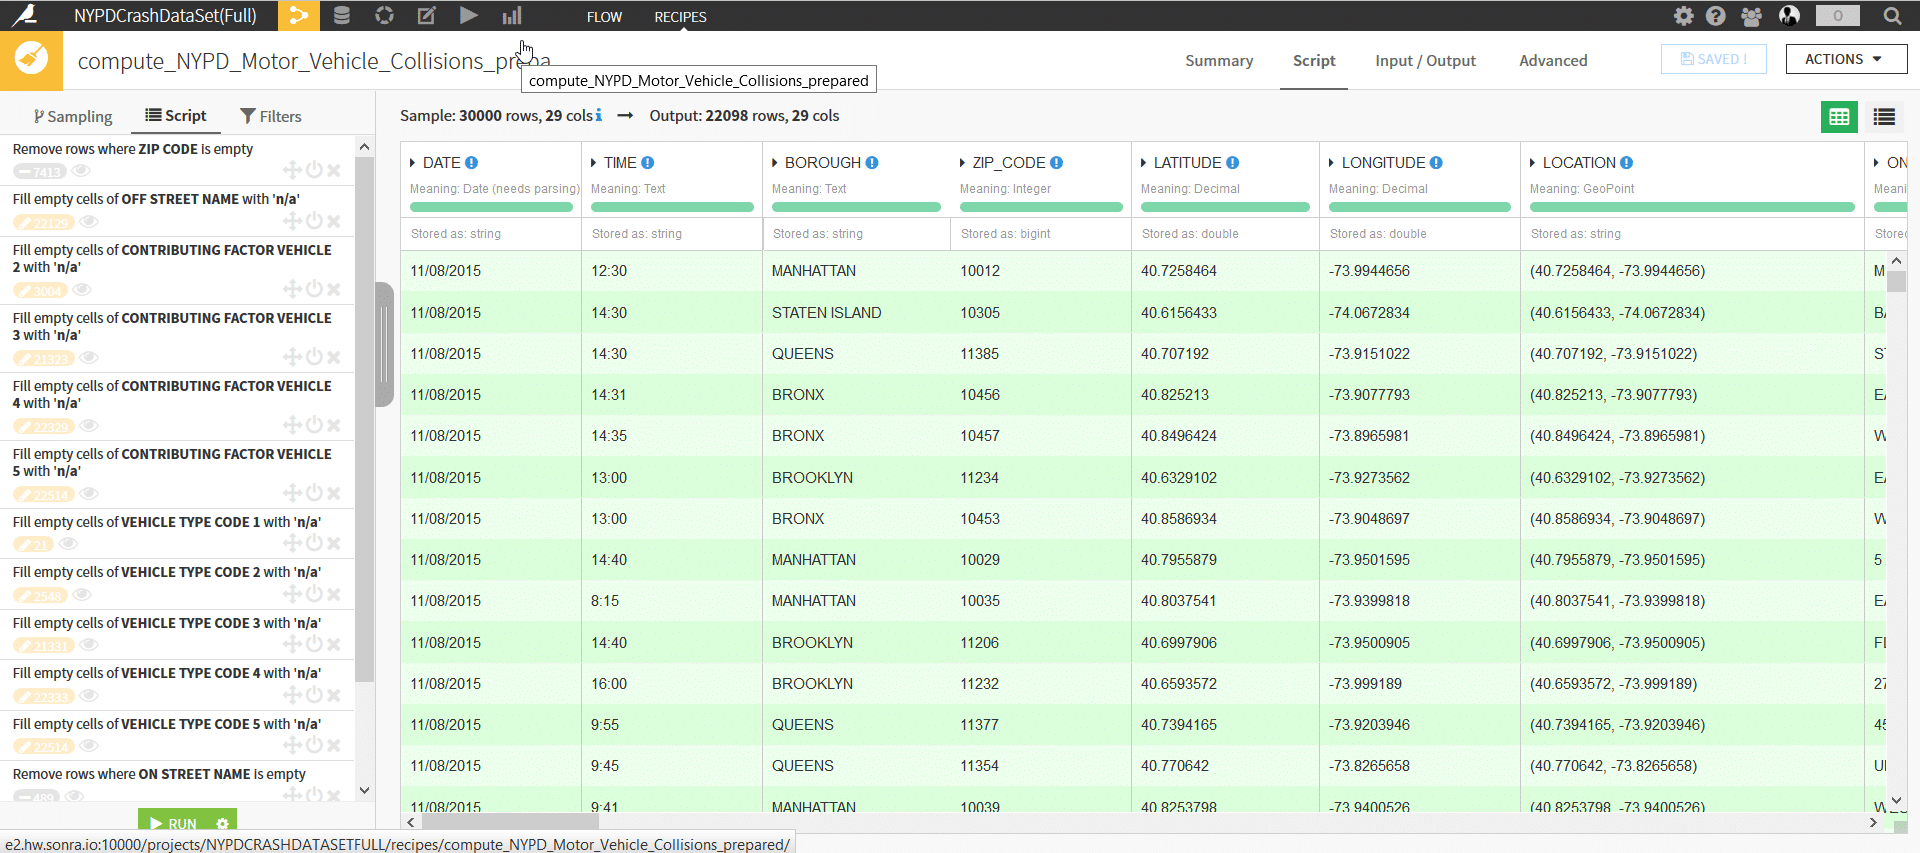
The transformations on offer are similar in nature and vary from simple to complex (fuzzy joins, text clustering, enriching data, working with arrays etc.). We found DSS to be more user-friendly. It lists any of the transformations and filters applied in a separate tab on the left hand side, which gives you all of the transformations at one glance. You can easily add, remove, and re-order your filters and transformations.
This gives you all of your transformations on a data set at one glance.
Both tools allow for inter-row calculations as a type of data transformation (think of running averages or the value in the previous or next row of a column). However, they take slightly different approaches. Datameer provides these transforms as part of the worksheet, whereas DSS provides this functionality in the familiar form of group by and window functions in a separate interface. Aggregations in Datameer are limited to the out of the box functions (unless you use the Java SDK to write some custom UDFs). DSS is more straightforward to use as it piggy backs on standard window functions which allow for partitioning of data sets and literally any inter row calculation under the sun. Window functions are part of the SQL ANSI standard and data analysts are familiar using them.
Machine Learning
Machine Learning in Datameer in many respects is an afterthought. As the name of the product already suggests this is where Dataiku Data Science Studio shines. Datameer has traditionally relied on third party plugins (Zementis PMML) to provide data science functionality. This is an awkward proposition as the data science life cycle sits outside Datameer. More recently, they have added functionality in the machine learning department through the separately licensed Smart Analytics feature. This is very basic and just offers three machine learning algorithms (clustering, decision trees, and recommenders).

Besides, Datameer integrates with a bunch of open source Java libraries for text analytics (sentiment analysis, entity extraction). There is no built in support for machine learning pipelines, feature selection, model evaluation, re-training models, querying models in realtime etc. DSS uses Python as its execution engine for machine learning algorithms. For large data sets it can piggy back on PySpark. The data science functionality is fully integrated into DSS and does not come as a plugin. It supports the standard supervised and unsupervised algorithms. Models can be built, trained, evaluated, and productionised from an easy to use GUI and if required can be converted to Python code.

Target Audience & Developer Functionality
Datameer is not targeted at data scientists who write their own code (R, Python, Scala etc.). The only interface to interact with data is through the spreadsheet like GUI. This is a major limitation. In a data lab you will find a mix of rolls and skillsets. Not catering for a large section of the data team is a major disadvantage. Together with the limitations in the area of data science, this is the biggest gap in the offering.
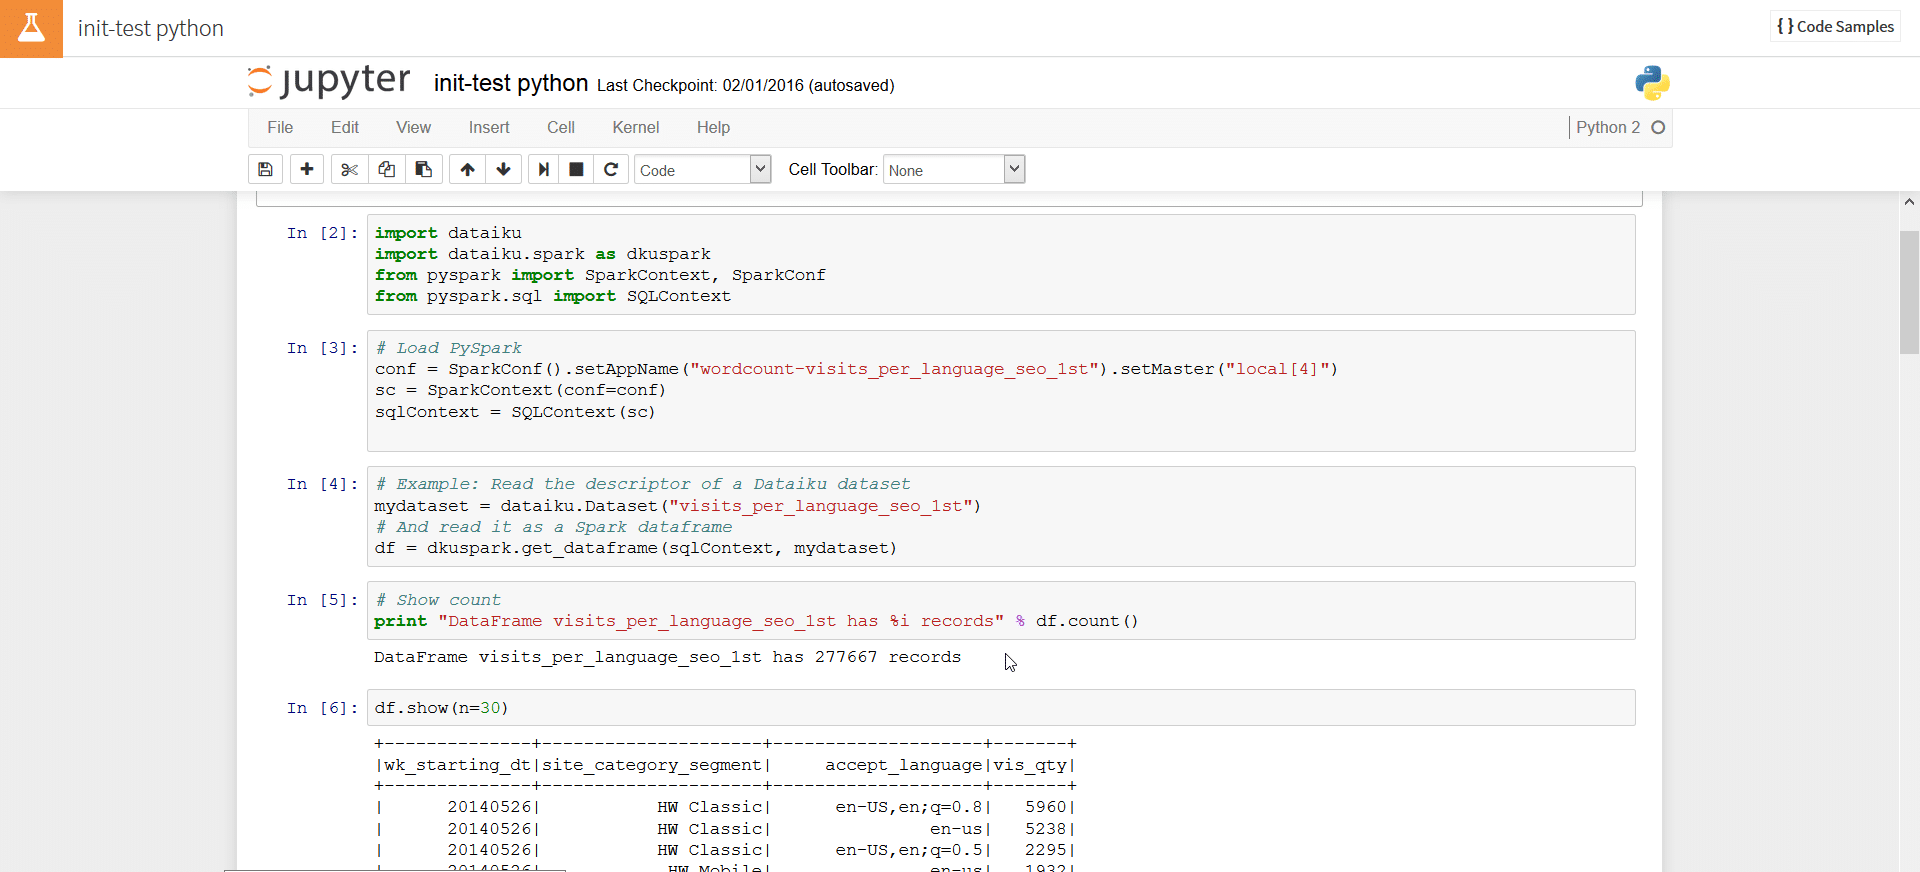
Contrast this with Dataiku. DSS is a full blown data apps development platform. Developers have various notebooks available to directly interact with data sets. Notebooks are development environments for data apps developers and data scientists. DSS comes with the following notebooks:
- A SQL Notebook to query data using the lingua franca of data.
- The Jupyter Python and R Notebook for data scientists.
- PySpark and Spark R Notebooks for processing large datasets using the Spark execution engine
- A Hive Notebook to query large data sets in Hadoop
Furthermore, DSS also comes with a browser based IDE to develop data driven applications. The IDE allows the developer to optionally include various Javascript libraries such as D3. Interactive charts and other custom data visualisations can be developed in no time using this feature. A great feature for prototyping.
Execution Engines for Transformations
Both tools use their own (in-memory) engine to process and transform smaller datasets. For larger datasets DSS supports multiple execution engines. You can push down your transformation code into Pig, Hive, MapReduce, and Spark. Datameer supports Map Reduce and Pig. Tez as an engine is licensed separately. Furthermore, as DSS supports Hive it indirectly supports the Hive execution engines ( Map Reduce, Tez, and Spark). Both tools can transform data in memory.
Visualisations and Dashboards
There are some significant differences between Dataiku DSS and Datameer. DSS ships with its own columnar compressed engine to run ad-hoc visualisations and charts. This is comparable to what you find at the backend of visualisation tools such as Tableau. For columns of low cardinality you can query very large datasets. We have tested 200M records and still got acceptable response times.

For larger datasets (billions of records) DSS offers other execution engines. Impala for Hadoop and PostgreSQL, Vertica for RDBMS. In Datameer it is more difficult to create charts and visualisations. The data needs to be aggregated up to the level of granularity that the chart represents. As a result there is no drill down or aggregations. For each segment or aggregation level in your data you need to create a separate data set. Datameer offers a richer set of chart types though.

Apart from the chart engine you can also integrate visualisations into dashboards from the various notebooks in DSS, e.g. the Jupyter Notebook, which in turn could be integrated with Plotly. Finally, DSS also comes with a web based IDE to develop web apps. This integrates with D3 and other Javascript libraries to easily develop custom charts.
Both tools allow exports to Tableau worksheets for more advanced visualisations.
ETL
ETL stands for Extract Transform Load. It is typically associated with loading a data warehouse. Developers with coding skills (typically SQL) and/or an ETL tool are used to transform the data. Dataiku DSS provides visual transforms to provide ETL functionality. You can aggregate data, split it, union it, create Joins, create window functions.

There is no ETL functionality in the traditional sense of the word in Datameer. You would need to make use of the worksheet as a workaround. You can join data in worksheets but Datameer does not have a complete set of aggregate functions that we know from SQL. Crucially it does not come with window functions. Instead it has a couple of proprietary functions to perform inter row calculations. Both products come with a built in scheduler and an orchestration engine for data transformations.

Conclusion
Both tools get the job done in the area of data profiling and self-service analytics. We found DSS to be easier to use when developing transformation scripts. The big differences lie in the machine learning capabilities of both platforms. Unless you use 3rd party plugins the Datameer offering is rather weak in the data science department. Besides, the predictive analytics functionality is licensed separately in Datameer. DSS also allows collaboration between data scientists with and without coding skills. We also found DSS to have an edge over Datameer in the data wrangling department. The interface is more intuitive and easier to navigate. Besides, we have a lot more transformation options via the visual transformation recipes and the Notebooks.
[big_data_promotion]
About Sonra
Sonra are the number one Big Data experts in Ireland. We help you to get the best value out of your data. We also run the Hadoop User Group (HUG) Ireland. We can help with your Big Data implementation. You can get in touch today, we would love to hear from you!