Converting MedlinePlus XML to QlikView
MedlinePlus is the National Institute of Health’s Web site for patients and their families and friends. Produced by the National Library of Medicine, the world’s largest medical library, it brings you information about diseases, conditions, and wellness issues in language you can understand. MedlinePlus offers reliable, up-to-date health information, anytime, anywhere, for free.
Table of Contents

MedlinePlus XML Format Guide
MedlinePlus publishes three types of health topic XML files daily. Files contain records in English and Spanish.
- MedlinePlus Health Topic XML
- MedlinePlus Compressed Health Topic XML
- MedlinePlus Health Topic Group XML
Each health topic record includes data elements associated with this topic. It includes:
- basic metadata (health topic title, URL, language, date created, and ID),
- vocabulary (MeSH, “Also called” terms, and see references),
- full summary,
- group membership,
- related health topics,
- equivalent English or Spanish topics,
- related content in other languages,
- primary NIH institute, and
- all site records (links) assigned to a health topic page, including their names, URLs, organizations, category assignments, and standard descriptions.
Downloading MedlinePlus XML
Since we now understand the XML format, we can continue and download MedlinePlus Health Topic XML.
We open the link and save it as XML file.

Converting MedlinePlus XML to Text (CSV/TSV)
Now that we have downloaded the XML we can convert the data to a format that can be easily loaded into QlikView. We will use the Flexter for this purpose. You can compare the features of the various Flexter editions on the Flexter product pages.
We first upload our XML data

We skip uploading the XSD Schema. Medline only provides schemas in DTD format.

Next we submit our e-mail address. You will get an e-mail with a download link to your converted data once Flexter has finished parsing the MedlinePlus XML.

That’s it.

Once we have downloaded our tab separated output (TSV) files we can extract them.
With Flexter, we have achieved in minutes what normally would take days or weeks of manual coding.

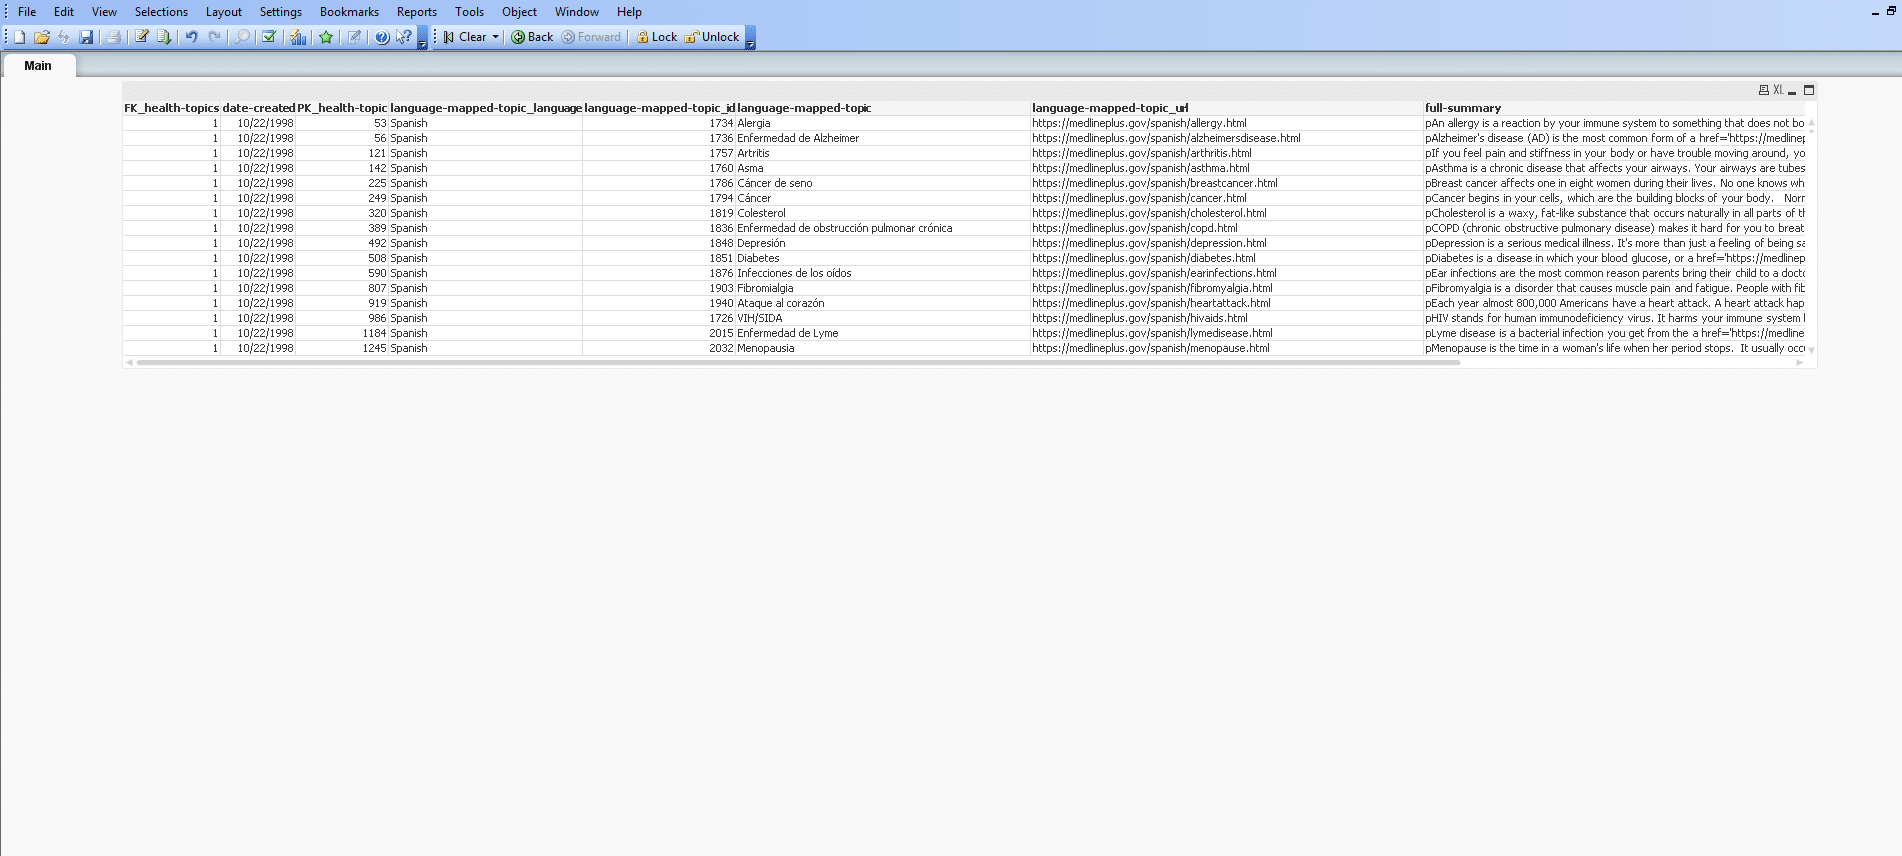
Let’s have a closer look at the health-topic.tsv file. As you can see it contains a primary key PK_health-topic and a foreign key FK_health-topics to the health-topics.tsv file.

Analysing MedlinePlus xml data in QlikView
Lets load the output from Flexter into QlikView. Qlik provides a free edition of their powerful data analysis tool.
- Let’s load health-topic.tsv, mesh-heading.tsv and group.tsv.
- We do this by oppening new file in QlikView.
- Next we click on Edit Script

- After that we click on Table files

- And chose the files we want to upload (Make sure that under “Files of type”, “All files” are selected)

- When you open your file, under Delimiter choose “TAB”

- And make sure option Embedded Labels under the “Labels” field is picked

- Do the same process for all the files you want to upload
- When you upload the files, click on Reload

- Next you will have to select which columns of the data you want. But since we will be making tables and charts you don’t need to select any at this moment.

2. Next we make Table Boxes in which we will show XML Data, and with which we can easily Analyze MedlinePlus data.
- When you click OK, you will get your project. Then you go to make a new table

- And select which columns you want in that table

As you can see you have your primary and foreign key already marked, which QlikView automatically mark while you are uploading files.
- When you select which columns you want click Apply and you will get your Table Box
3. Now we will make a Chart in QlikView
- You start the same way as when you make a Table, but now you choose Chart Option

- Give your Chart a name and click Next

- Select which column you want in that Chart

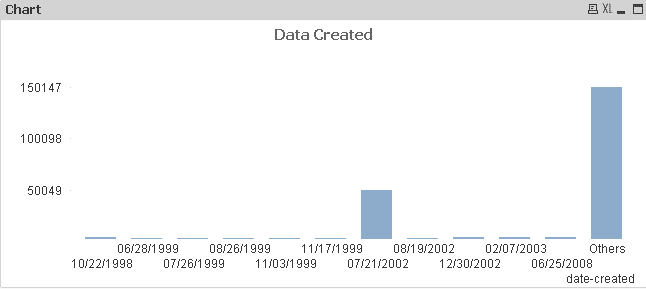
- In Edit Expression field write Sum([date-created])

And when you click OK, you will get your chart with date and numer of articles
Now we are done with making tables and charts.
When two or more input tables have two or more fields in common, this
implies a composite key relationship. QlikView handles this through synthetic
keys. These keys are anonymous fields that represent all occurring
combinations of the composite key.
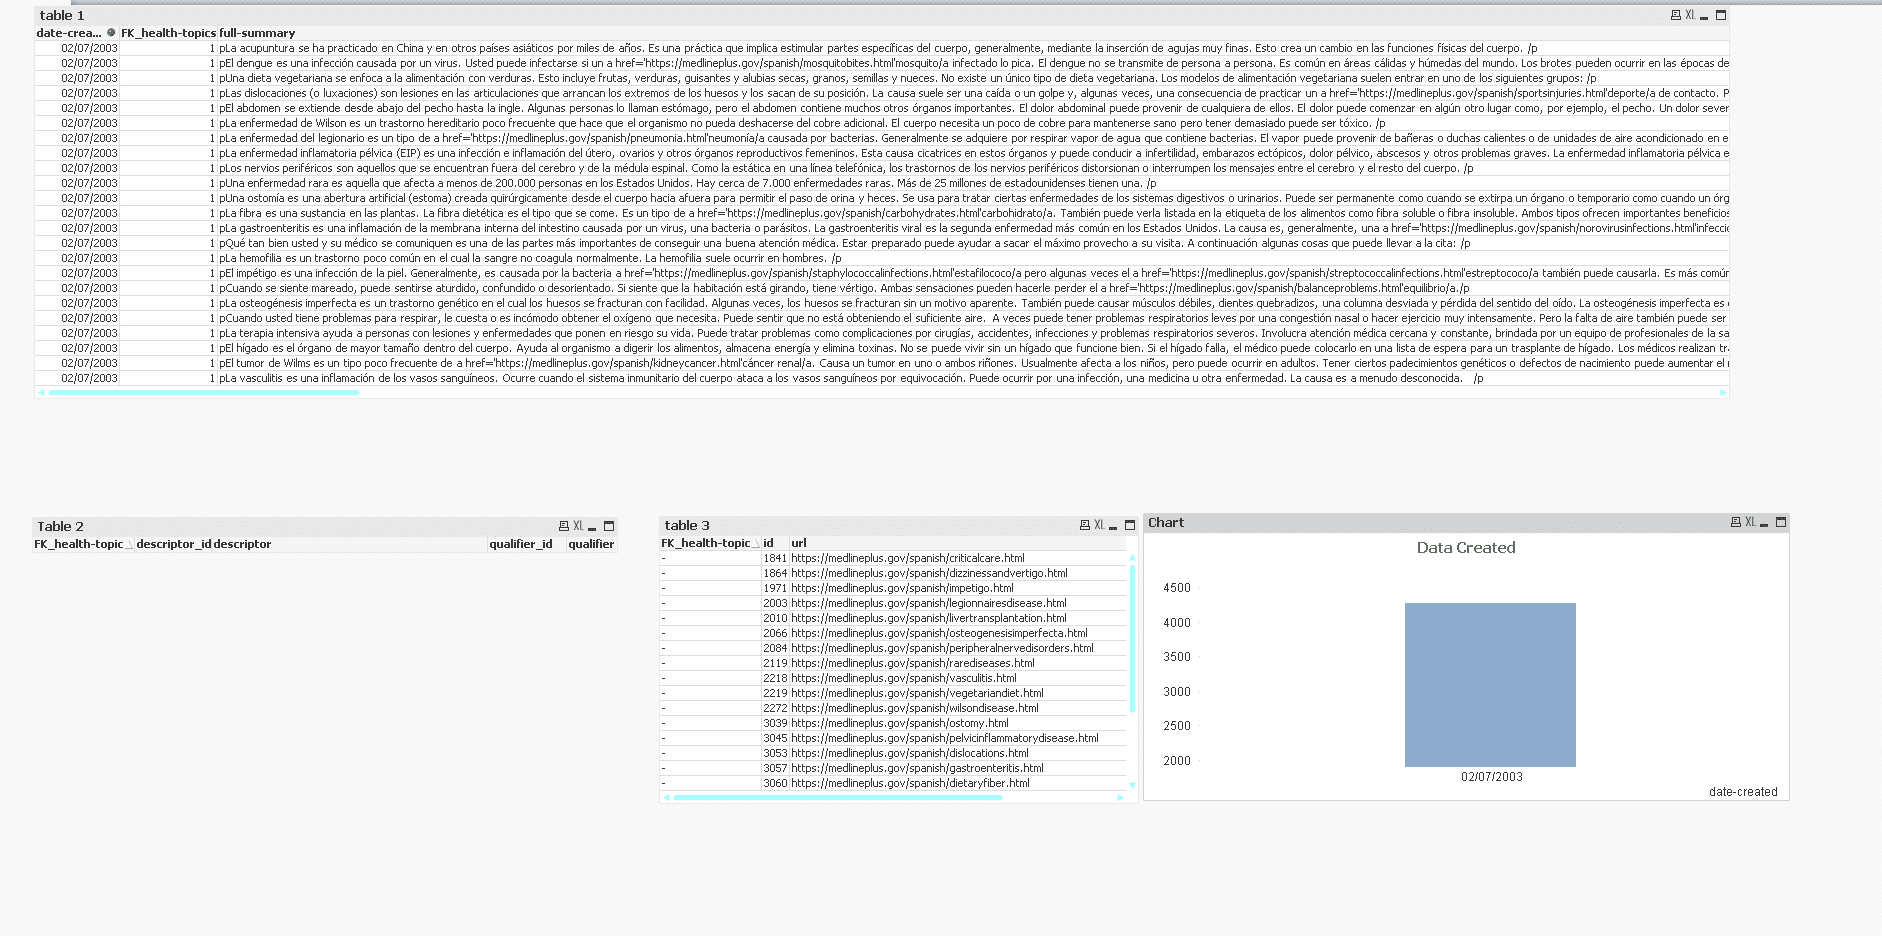
You can see it with clicking CTRL + T. It will show you ER diagram, in which you can see which Column is connecting all those Tables.

Now we can easily filter out the Articles that are made in 2003, by just picking that year in Chart:
Conclusion: XML Conversion and Analysis with QlikView
It took me just ten minutes from downloading the data from the MedlinePlus website to converting XML into TSV, loading it into QlikView and performing some quick analysis. This shows you what is achievable when two powerful tools such as Flexter and QlikView work together. You can achieve in minutes what normally would take weeks.
Which data formats apart from XML also give you the heebie jeebies and need to be liberated? Please leave a comment below or reach out to us.