Master Snowflake Data Lineage – Features, Tools & Tips

What is Snowflake data lineage?
Imagine you’ve just touched down in a bustling, unfamiliar city you’re eager to explore. You step outside your hotel and realise you have no idea where you are or how to get where you’re going. No problem, you pull out your phone and open Google Maps, your guide to street names, landmarks, distances, and directions. You know you’d be lost without it, wandering aimlessly around a maze of city streets you’ve never seen before, never to reach your destination.
This analogy mirrors the world of data pipelines in Snowflake. Imagine the data pipelines we construct as a network of roads and landmarks. It would be hard navigating this web of tables, views and objects without a ‘map’ of how these pieces fit together.
Data lineage is the map of the data-driven metropolis you’ve created. It shows the path of data from its origins through its various transformations, allowing you to trace each step. It shows you the big picture, just like the map shows you the whole city, and helps you to navigate your Snowflake data pipelines. Companies operating in highly regulated fields can work alongside our certified Snowflake professionals to systematically map data dependency paths.
😆 Data lineage is a bit like a genealogy search: you always end up finding a few skeletons in the data warehouse.
Snowflake is the first data platform to offer native column-level data lineage, which sets it apart from the competition.
Data lineage comes in multiple flavours:
- Snowflake first introduced data lineage in the ACCOUNT_USAGE.ACCESS_HISTORY view, which provides information on how source table columns map to target table columns for SQL write operations. It collects this information on a query-by-query basis. You can then stitch this information together by identifying the recursive hierarchy and dependencies between columns and tables.
- This requires a lot of coding, so Snowflake has recently introduced an end-to-end solution based on a visual lineage solution inside Snowsight, the Snowflake UI data pipelines and dependencies can be visualised in.
- Snowflake also displays tags attached to objects in a data lineage graph. Snowflake also announced a new feature at Summit 2024: automatic tag propagation, which is currently in private preview (as of November 2024).
- You can use the data lineage visualisation for machine learning (ML lineage) as dependencies of ML specific objects such as Feature Views, Datasets, and Models can also be visualised.
- Snowflake also provides programmatic access to data lineage via SQL functions, the ML API, or the Snowpark Python API.
In this blog post, I’ll explore these topics further and we’ll discuss scenarios where you may need an external data lineage tool to handle more advanced requirements than ‘out of the box’ Snowflake is capable of.
If you’re in a rush, I have compiled the key takeaways here.
Key Takeaways
- Snowflake is one of the few data platforms that provides data lineage as a native feature.
- Snowflake data lineage proves basic features
- You can visualise data lineage in a diagram using the UI in Snowsight. This visualisation follows the neighbourhood view approach. You’ll pick a starting point, like a table or view to be the main focus. From there, you can follow the data flow either upstream (from its source) or downstream (where it’s used).
- Data lineage is also available for Snowflake’s Machine Learning features and objects. You can trace the lineage of ML specific objects such as Models or Feature Views.
- For write operations such as INSERT, CTAS, and MERGE, data lineage is stored in the view ACCESS_HISTORY in the ACCOUNT_USAGE schema. For each query the source table columns are mapped to the target table columns in a JSON array in column OBJECTS_MODIFIED.
- Data lineage in Snowflake can be accessed programmatically through three available flavours of APIs.
- Snowflake tag lineage, which is about tag inheritance, must not be confused with data lineage or automatic tag propagation.
- Snowflake lineage doesn’t visualise SQL queries though, you’ll need an SQL visualiser to do that.
- If you want to go beyond the basics I recommend looking at a third party data lineage tool.
Use Flexter to turn XML and JSON into Valuable Insights
- 100% Automation
- 0% Coding
Snowflake lineage and the Horizon Catalog
Snowflake data lineage is an integral part of the Horizon Catalog.
The Horizon Catalog covers several key areas. Data Discovery is one of them and is powered by Snowflake Universal Search. It’s an AI-driven tool I’ve found quite useful for locating data, apps, and other resources.
Another area, Data Governance audits who has accessed the data, monitors data quality, tracks dependencies and also includes tracking data lineage or auditing object dependencies.
Security and Privacy, another component of Horizon ensures that your data is secure with end-to-end encryption, access controls, tagging, and differential privacy. With it, you can be confident your sensitive data is well protected.
Data lineage for data engineering
People tend to have a narrow view of data lineage, mostly thinking of it in the context of data governance. Data lineage has some value there, but I honestly think its real value lies in the field of data engineering. Data engineers benefit from data lineage in multiple ways, such as documenting data pipelines, tracking data transformations across pipelines, data pipeline migration, change management (or impact analysis), troubleshooting data issues, documentation, debugging, and optimising workflows.
Now that we have some context for data lineage as it applies to this conversation, let’s dive into the various features and see how they work.
FlowForward.
All Things Data Engineering
Straight to Your Inbox!
ACCESS_HISTORY – Snowflake lineage from query
Snowflake stores the data lineage mappings for each write query (DML) you run in the ACCESS_HISTORY view in the ACCOUNT_USAGE schema.
This schema holds object metadata as well as historical usage data for your Snowflake account.
- Object metadata is about database objects (like tables, views, schemas, etc.) that describe its structure, properties, and other attributes of the object.
- Usage data shows how database objects (like tables, views, and warehouses) are accessed and queried by your Snowflake users. You can use this information for optimising performance, managing costs, and data governance.
Note
ACCESS_HISTORY can only be accessed 🙂 if you are on a Snowflake Enterprise plan. It is not supported for Standard plans.
Object metadata is also available in the Snowflake Information Schema. However, there are some key differences between ACCOUNT_USAGE and Information Schema. Account Usage views include dropped objects, with additional columns for timestamps and IDs to track changes, while Information Schema views do not retain dropped object records.
Account Usage views have a data latency of 45 minutes to 3 hours, whereas Information Schema views provide real-time data. Historical data is retained for up to a year in Account Usage Views, but only 7 days to 6 months in Information Schema views.
In summary:
| Account Usage | Information Schema | |
|---|---|---|
| State | History of metadata for deleted objects | Only current state of metadata |
| Scope | Usage and object metadata | Mainly object metadata with limited info about usage |
| Latency | Up to 3 hours | Real time |
| Data retention | Up to 12 months | 7 days to 6 months |
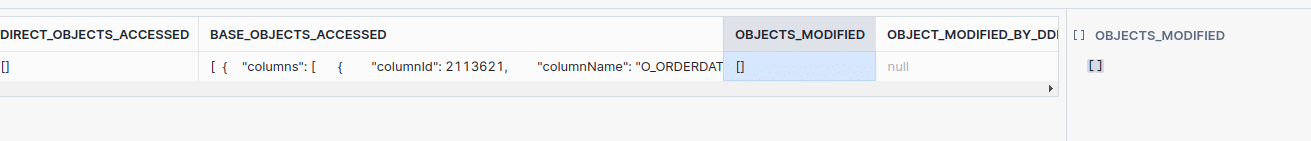
ACCESS_HISTORY stores the following information
- The type, name, and ID of objects that were accessed in a query. This information is stored as JSON arrays in columns DIRECT_OBJECTS_ACCESSED and BASE_OBJECTS_ACCESSED.
- Data lineage at the column level for DML such as INSERT, CTAS, MERGE etc. The column OBJECTS_MODIFIED contains the mappings between source and target columns in a query.
- Operations that involve DDL such as creating or altering a table are logged in column OBJECT_MODIFIED_BY_DDL.
- If a query references a policy, e.g. a data masking policy it is logged in column POLICIES_REFERENCED.
Note
Snowflake stores most but not all queries in ACCESS_HISTORY.
For a comprehensive list of what type of queries Snowflake stores in ACCESS_HISTORY have a look at the usage notes.
Let’s go through some examples to understand what Snowflakes stores in column DIRECT_OBJECTS_ACCESSED before comparing it to BASE_OBJECTS_ACCESSED
Examples for DIRECT_OBJECTS_ACCESSED
Let’s start with a simple SQL query
I have run the following query and then looked up DIRECT_OBJECTS_ACCESSED in ACCESS_HISTORY.
|
1 2 3 4 5 6 7 8 9 10 |
SELECT Hire_Date, Age, Department, Employee_ID, Name, FROM DB_SAURABH_GUPTA.SAMPLE_SCHEMA.EMPLOYEE_DETAILS_SRC WHERE Salary > 60000; |
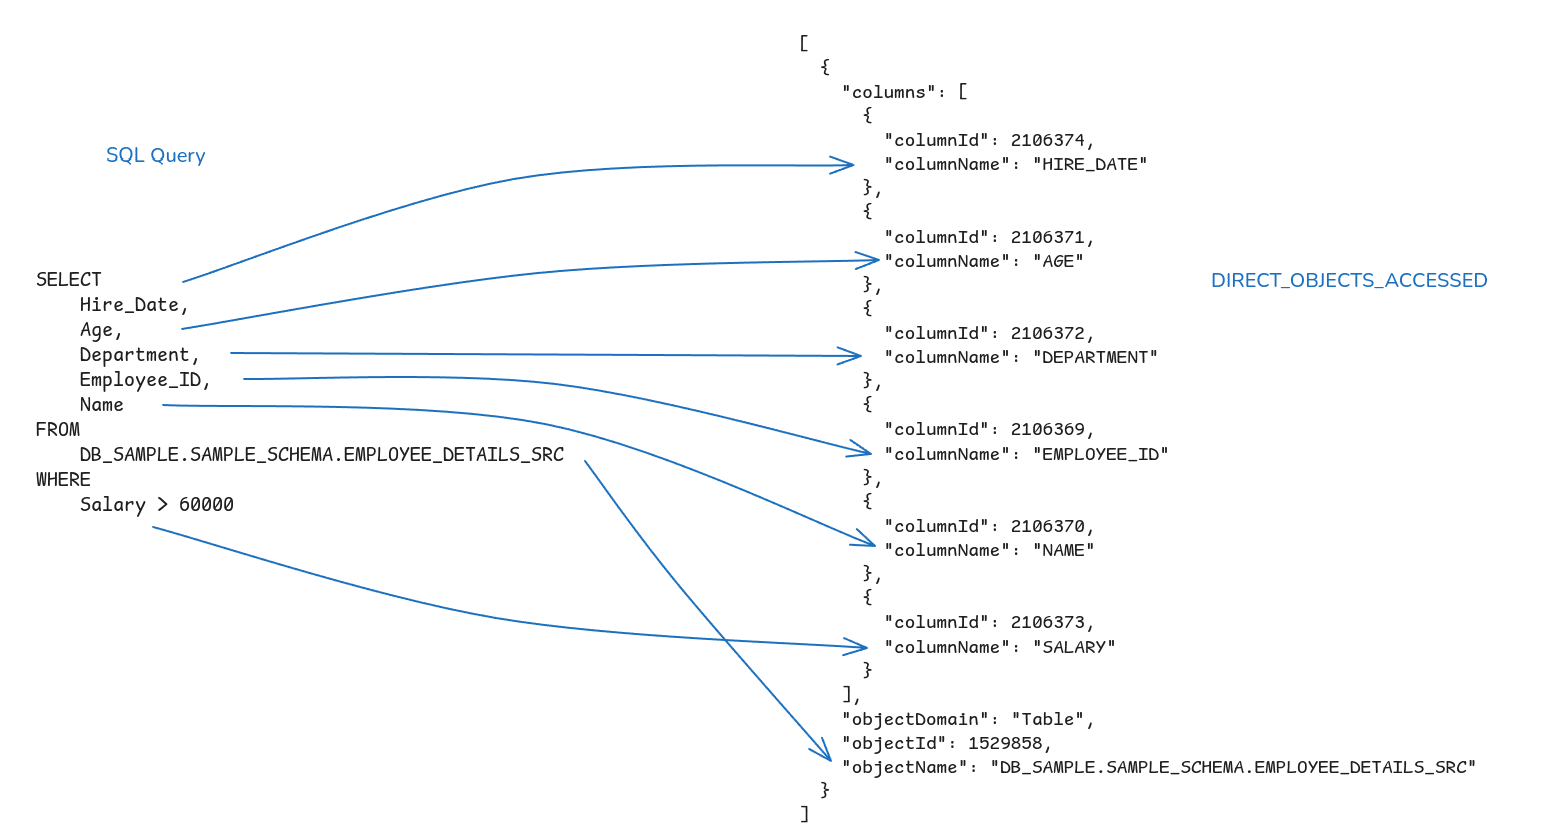
I have made the following observations
- All columns that I used in my SQL query are listed in the JSON array. This includes the Salary column in the WHERE clause.
- Information about where exactly the column was used in the query is not available, e.g. we do not know from the JSON that the columns Hire_Date, Age etc. are part of the SELECT clause (projected columns) and that Salary is part of the WHERE clause.
- The database and schema are not listed as separate objects but are included as part of the Table objectName. If you need this info you will need to parse it out manually.
- If you run a query such as SELECT * FROM table1, Snowflake will look up the columns in table1 and resolve the asterisk (*) to the actual column names and column IDs.
Stored procedures and ACCESS_HISTORY
Queries inside a stored procedure can also be tracked via ACCESS_HISTORY. Columns parent_query_id and root_query_id can be used to unnest queries inside a stored procedure.
Let’s go through an example.
I have created a stored procedure with a couple of SQL queries.
|
1 2 3 4 5 6 7 8 9 10 11 12 13 14 15 16 17 18 19 20 21 22 23 24 25 26 27 28 29 30 31 32 33 34 35 36 37 38 39 40 41 42 43 44 45 46 |
CREATE OR REPLACE PROCEDURE Get_Employees_Age_Range( min_age INTEGER, max_age INTEGER ) RETURNS STRING LANGUAGE SQL AS $ DECLARE result STRING; employee_count INTEGER; BEGIN SELECT COUNT(*) INTO :employee_count FROM EMPLOYEE_DETAILS_SRC WHERE Age BETWEEN :min_age AND :max_age; IF (employee_count = 0) THEN RETURN 'No employees found in age range ' || min_age || ' to ' || max_age; END IF; SELECT LISTAGG(Name, ', ') INTO :result FROM EMPLOYEE_DETAILS_SRC WHERE Age BETWEEN :min_age AND :max_age; -- Insert into tracking table INSERT INTO EMPLOYEE_AGE_RANGES( age_range_min, age_range_max, employee_list ) VALUES ( :min_age, :max_age, :result ); RETURN 'Successfully inserted ' || employee_count || ' employees for age range ' || min_age || ' to ' || max_age || ': ' || result; EXCEPTION WHEN OTHER THEN RETURN 'Error occurred: ' || SQLSTATE || ' - ' || SQLERRM; END; $; |
Let’s execute this stored procedure.
|
1 |
CALL Get_Employees_Age_Range(35, 45); |
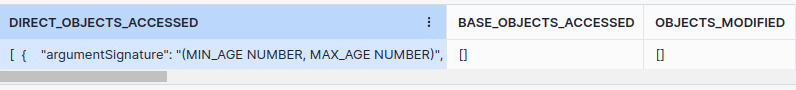
This gives us the following result in ACCESS_HISTORY.DIRECT_OBJECTS_ACCESSED.
|
1 2 3 4 5 6 7 8 9 |
[ { "argumentSignature": "(MIN_AGE NUMBER, MAX_AGE NUMBER)", "dataType": "VARCHAR(16777216)", "objectDomain": "Procedure", "objectId": 6387, "objectName": "GET_EMPLOYEES_AGE_RANGE" } ] |
As you can see a few additional columns have been added
Argument signature (argumentSignature): The argumentSignature column outlines the input parameters a function or procedure requires,
Return data type (dataType): This column specifies the data type that the procedure or function returns to the caller
It is worthwhile noting that the BASE_OBJECTS_ACCESSED column is not populated.
In order to get the details for the SQL inside the stored procedure, I used the query_id of the call to the stored procedure to filter on ACCESS_HISTORY.ROOT_QUERY_ID
|
1 2 3 4 5 6 7 |
select * from snowflake.account_usage.access_history a join snowflake.account_usage.query_history b on a.query_id = b.query_id where a.root_query_id = '01b7ebc8-0303-9870-0000-011d02c012ee' |

As you know, it’s possible to nest calls to stored procedures inside a stored procedure thereby creating a tree or a cascade, if you will, of stored procedure calls.
ACCESS_HISTORY provides column ROOT_QUERY_ID, PARENT_QUERY_ID, and QUERY_ID to recursively iterate over this hierarchy.
DIRECT_OBJECTS_ACCESSED vs. BASE_OBJECTS_ACCESSED
Data engineers love to matryoshka their code with views 😁! They’ll stack database objects layer by layer, just like those famous Russian nesting dolls. One view will reference another, which references another, and so on… until you’re in the basement of a database dollhouse, or that weird half-bath under the stairs!
The column BASE_OBJECTS_ACCESSED in ACCESS_HISTORY works well for this scenario. There are times when you need to include or reference another database object. The most (in)famous example is the nesting of views. But you can also nest UDFs, UDTFs, and Stored Procedures.
While DIRECT_OBJECTS_ACCESSED shows only the immediate objects a query directly calls, BASE_OBJECTS_ACCESSED shows any base objects that were accessed. However, information is not available for intermediate objects.
Let’s go through some detailed examples to make this point clear.
Example of View
I’ll illustrate how this works with a simple example.
First, we’ll create a view high_earners, which selects from table employee_details_src.
|
1 2 3 4 5 6 7 8 9 10 11 12 |
CREATE VIEW high_earners AS SELECT Employee_ID, Name, Age, Department, Salary, Hire_Date FROM EMPLOYEE_DETAILS_SRC WHERE Salary > 60000; |
Next, I’ll run a query to SELECT from this view.
|
1 2 3 4 |
SELECT department ,SUM(salary) FROM DB_SAMPLE.SAMPLE_SCHEMA.HIGH_EARNERS GROUP BY department; |
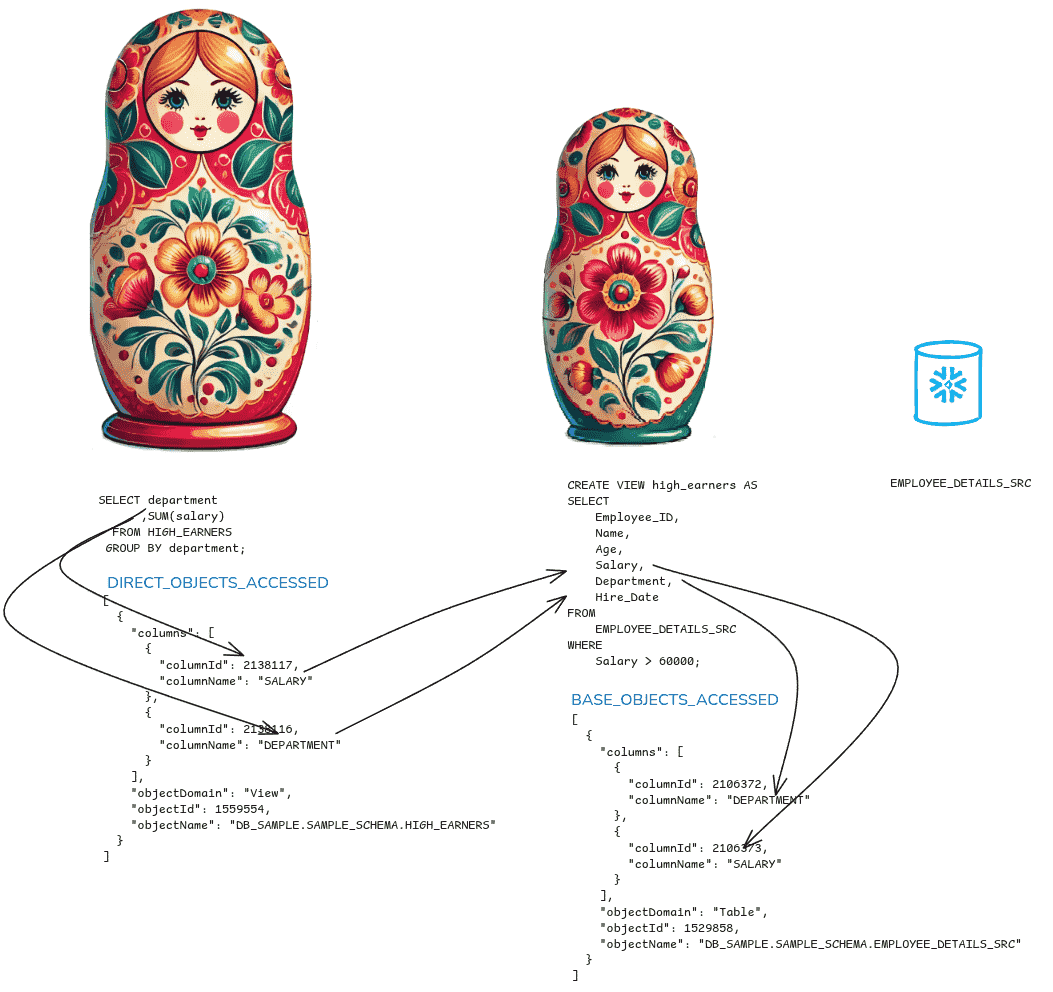
DATA_OBJECTS_ACCESSED contains the objects that were directly accessed by running the SELECT query, whereas BASE_OBJECTS_ACCESSED contains the leaf objects that were accessed.
The view HIGH_EARNERS is the object directly accessed, and table EMPLOYEE_DETAILS_SRC is the base object accessed.
Example of inline view
In the next experiment I replaced the database view with an inline view.
|
1 2 3 4 5 6 7 8 9 10 11 12 13 14 15 16 17 |
SELECT department ,SUM(salary) FROM ( SELECT Employee_ID, Name, Age, Salary, Department, Hire_Date FROM DB_SAURABH_GUPTA.SAMPLE_SCHEMA.EMPLOYEE_DETAILS_SRC WHERE Salary > 60000 ) high_earners GROUP BY department; |
The values in DATA_OBJECTS_ACCESSED and BASE_OBJECTS_ACCESSED were identical.
|
1 2 3 4 5 6 7 8 9 10 11 12 13 14 15 16 17 18 19 20 21 22 23 24 25 26 27 28 29 30 31 32 33 |
[ { "columns": [ { "columnId": 2106374, "columnName": "HIRE_DATE" }, { "columnId": 2106371, "columnName": "AGE" }, { "columnId": 2106372, "columnName": "DEPARTMENT" }, { "columnId": 2106369, "columnName": "EMPLOYEE_ID" }, { "columnId": 2106370, "columnName": "NAME" }, { "columnId": 2106373, "columnName": "SALARY" } ], "objectDomain": "Table", "objectId": 1529858, "objectName": "DB_SAURABH_GUPTA.SAMPLE_SCHEMA.EMPLOYEE_DETAILS_SRC" } ] |
As you can see, Snowflake does not treat an inline View as a separate base object. The base and direct object is table EMPLOYEE_DETAILS_SRC for the inline view.
Example of nested views
Now I’ll add another layer by creating a new view that selects data from the RECENT_HIGH_EARNERS view.
|
1 2 3 4 5 6 7 8 9 10 11 |
CREATE VIEW recent_high_earners AS SELECT Employee_ID, Name, Age, Department, Salary FROM high_earners WHERE Hire_Date >= DATEADD(YEAR, -5, CURRENT_DATE); |
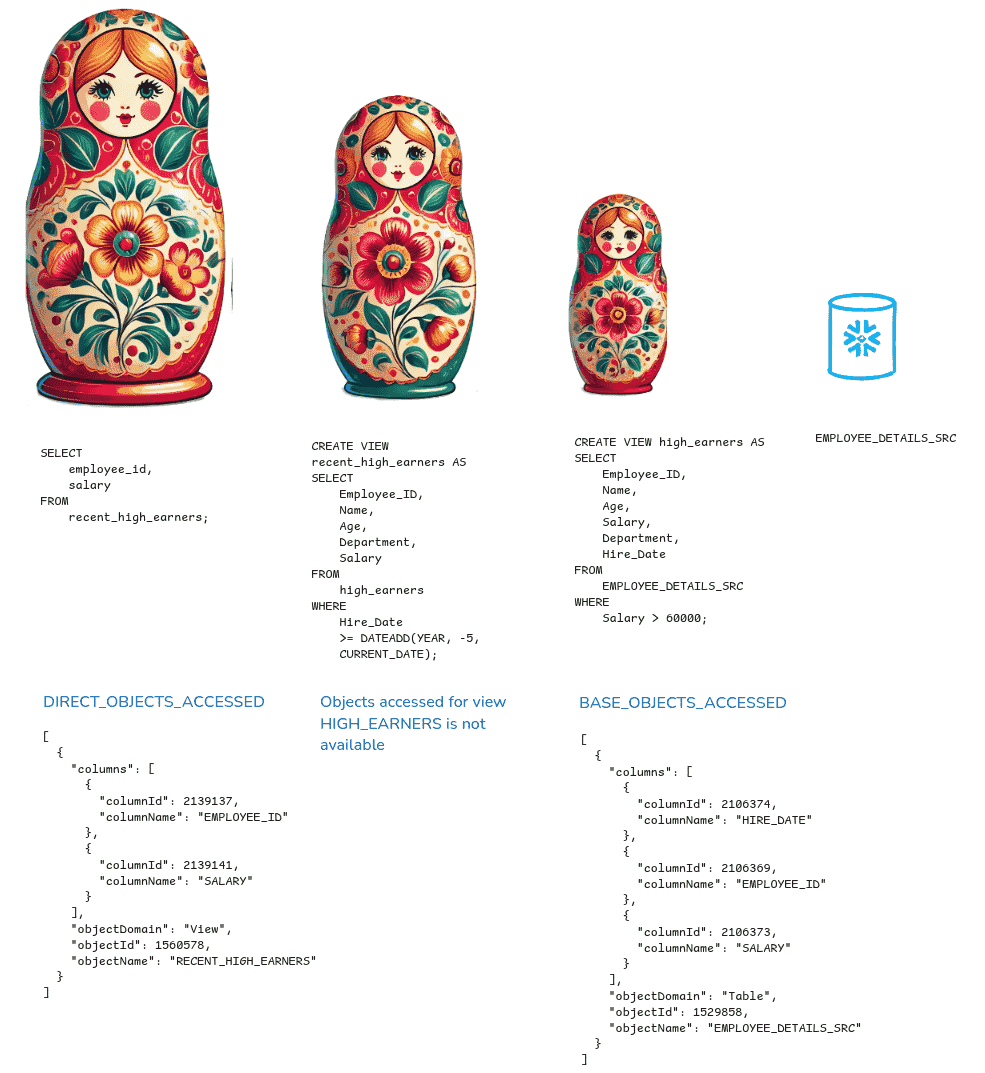
The direct object accessed in this example is the view RECENT_HIGH_EARNERS. The base object is table EMPLOYEE_DETAILS_SRC. No information is logged for view HIGH_EARNERS as it is an intermediate object.
Snowflake column level lineage in OBJECTS_MODIFIED
The mappings from source to target for Snowflake column lineage can be found in ACCESS_HISTORY.OBJECTS_MODIFIED.
For SQL queries involving DML (Data Manipulation Language) such as INSERT, MERGE, UPDATE, and DELETE, the column OBJECTS_MODIFED tracks how the columns from zero, one, or more source tables are mapped to a target table.
The following write statements are recorded in the column OBJECTS_MODIFIED for data lineage.
- GET <internal_stage>
- PUT <internal_stage>
- DELETE
- TRUNCATE
- INSERT
- MERGE INTO … FROM SELECT *
- UPDATE
- Data loading statements:
- Data unloading statements:
- CREATE:
Let’s look at a simple write operation to make sense of what is stored in OBJECTS_MODIFIED.
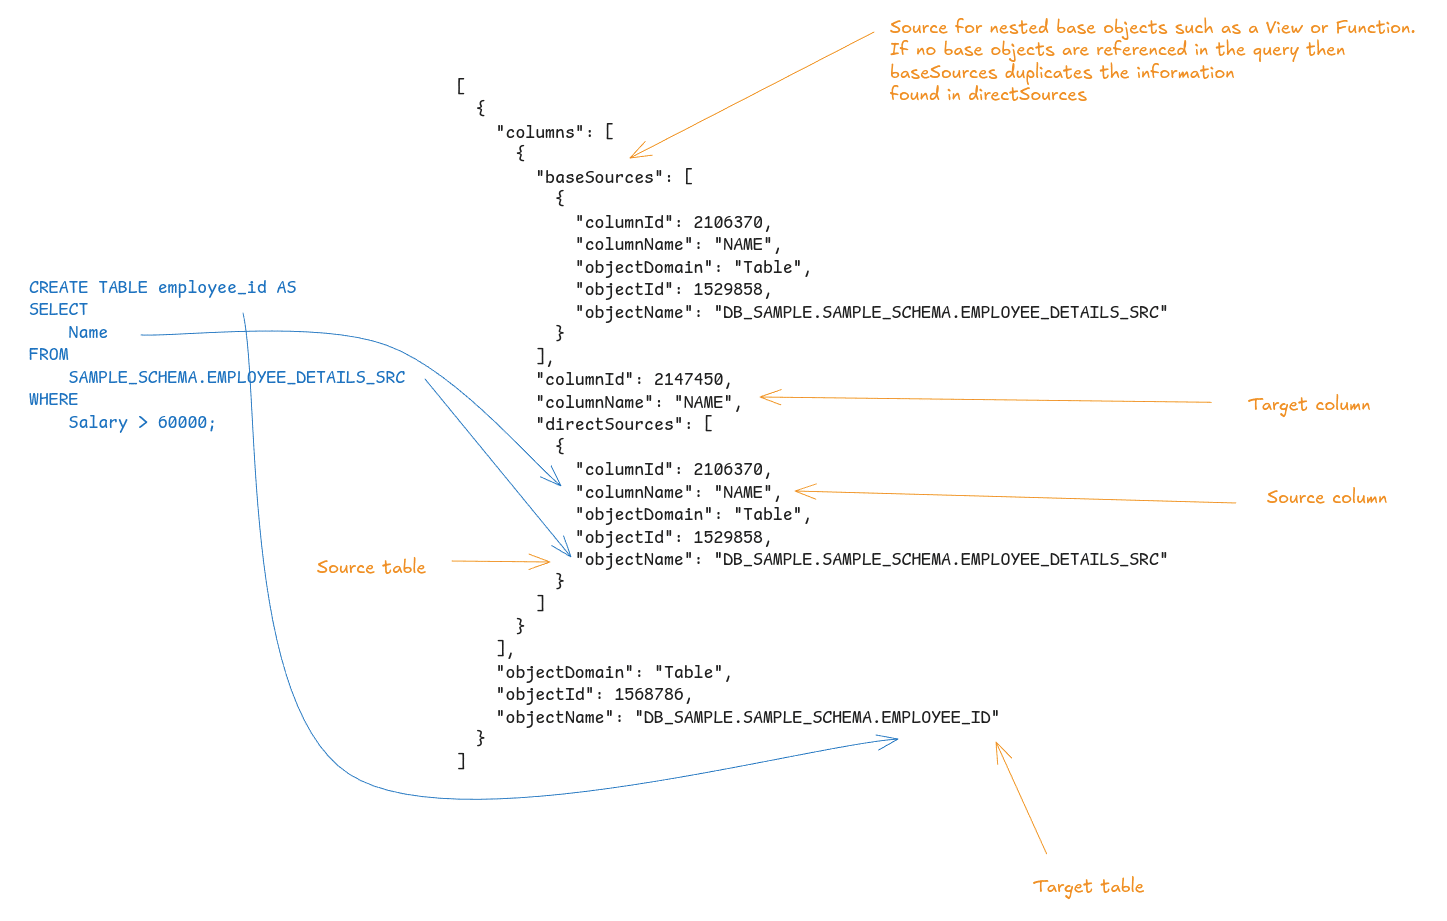
- The JSON array includes the target object (table
EMPLOYEE_ID) and its associated target column (NAME). - For each target column, both direct sources and base sources are identified. If there are no underlying objects like views or functions, the base source is the same as the direct source. In this case, for the target column (
NAME), the source column (NAME) is listed as well. - It’s important to note that only direct lineage is recorded in
OBJECTS_MODIFIED. This means that details like the filter on theSalarycolumn in theWHEREclause aren’t captured. Indirect lineage involving a more extensive chain of dependencies between data objects, isn’t stored. As a result, certain use cases, like impact analysis, aren’t fully supported.
I’ll go through a comprehensive list of examples to illustrate how data lineage works for different types of DML such as INSERT ALL, Subqueries, COPY, CTAS, and for different types of objects such as external tables, views, and stages.
But let’s first look at how you can make the JSON array in OBJECTS_MODIFIED a bit more readable.
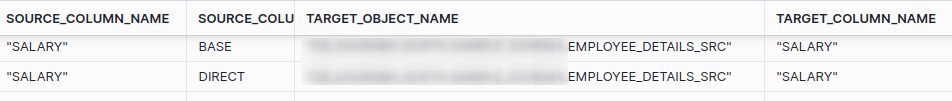
Flattening OBJECTS_MODIFIED for data lineage mappings
We’ll need to flatten the data to make the JSON array more readable.
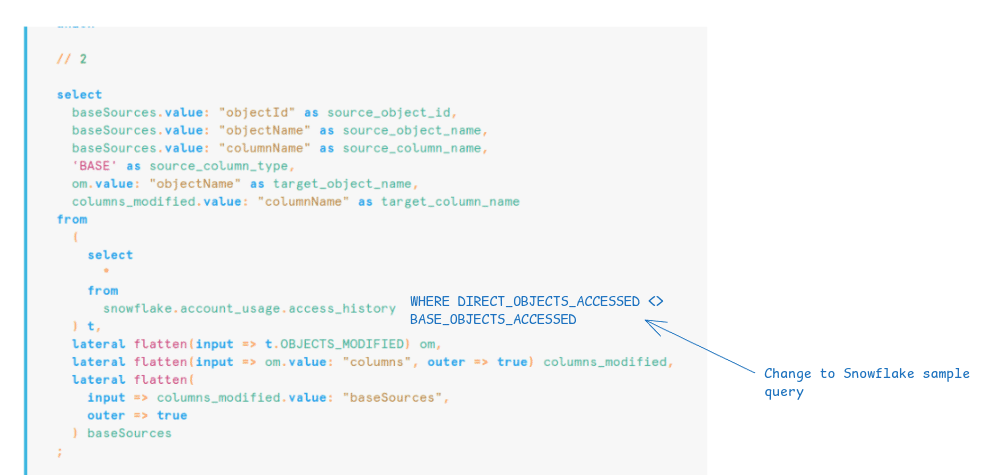
The Snowflake docs provide a sample query that does just that.

Because no base objects are involved in our query, the record with SOURCE_COLUMN_TYPE value BASE is redundant.
By adding a small change to the sample query, we can filter out records where the query didn’t involve a base object.
Let’s go through a few more examples to demonstrate the data lineage for different types of write queries
Example CTAS
|
1 2 3 4 5 6 7 8 9 10 11 |
CREATE or REPLACE TABLE New_Hires_Details AS SELECT Department, COUNT(*) AS Total_Employees, SUM(CASE WHEN Hire_Date >= DATEADD('YEAR', -2, CURRENT_DATE) THEN 1 ELSE 0 END) AS New_Hires_Count FROM EMPLOYEE_DETAILS_SRC GROUP BY Department, Age -- Including Age in the GROUP BY clause ORDER BY New_Hires_Count DESC; |
The data lineage mapping for CTAS
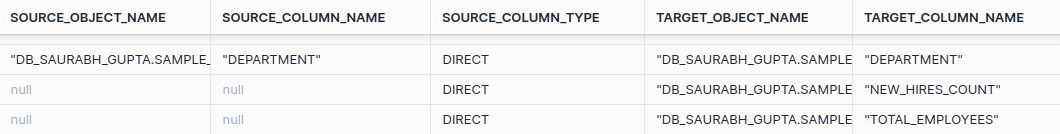
- It is worthwhile noting that the business logic SUM(CASE WHEN Hire_Date >= DATEADD(‘YEAR’, -2, CURRENT_DATE) THEN 1 ELSE 0 END) is not recorded.
- Column Hire_Date that is used in the business logic is not recorded.
Example: Data lineage sourceless DML
Sometimes we won’t work with a source table to load data to a target table. This is the case for INSERT INTO TABLE … VALUES (). Consider the following SQL statement.
|
1 2 |
INSERT INTO employees (employee_id, first_name, last_name, department, salary) VALUES (101, 'John', 'Doe', 'Sales', 55000); |
No source tables are involved
Example: Data lineage INSERT ALL
Most of the time, we’re working with a single target table, unless we’re using the INSERT ALL statement where multiple tables can be populated at the same time.
|
1 2 3 4 5 6 7 8 9 |
INSERT ALL INTO EMPLOYEE_AGE_RANGES (AGE_RANGE_MIN, AGE_RANGE_MAX, EMPLOYEE_LIST) VALUES (20, 29, 'John Doe, Jane Smith') INTO EMPLOYEE_DETAILS_SRC (EMPLOYEE_ID, NAME, AGE, DEPARTMENT, SALARY, HIRE_DATE) VALUES (1, 'Alice', 28, 'Engineering', 70000, '2020-01-15') INTO EMPLOYEE_DETAILS_SRC (EMPLOYEE_ID, NAME, AGE, DEPARTMENT, SALARY, HIRE_DATE) VALUES (2, 'Bob', 34, 'Marketing', 60000, '2019-03-22') |
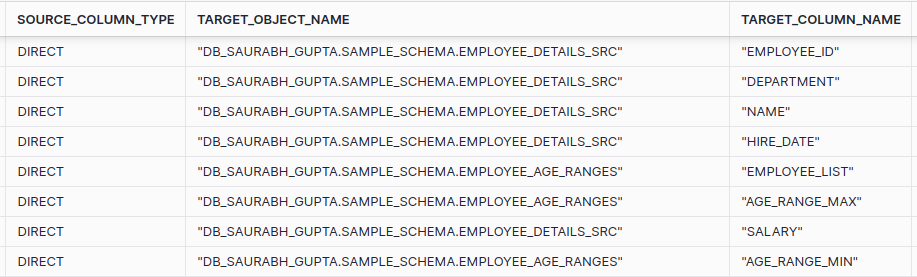
Both of the target tables EMPLOYEE_AGE_RANGES and EMPLOYEE_DETAILS_SRC are included.
Example: Data lineage External Table
I created an External Table over a CSV in a Stage
|
1 2 3 4 5 6 7 8 9 10 11 12 13 14 15 16 17 |
CREATE OR REPLACE EXTERNAL TABLE EXT_NETFLIX_TITLES ( show_id STRING AS (VALUE:c1::STRING), type STRING AS (VALUE:c2::STRING), title STRING AS (VALUE:c3::STRING), director STRING AS (VALUE:c4::STRING), cast STRING AS (VALUE:c5::STRING), country STRING AS (VALUE:c6::STRING), date_added STRING AS (VALUE:c7::STRING), release_year STRING AS (VALUE:c8::STRING), rating STRING AS (VALUE:c9::STRING), duration STRING AS (VALUE:c10::STRING), listed_in STRING AS (VALUE:c11::STRING), description STRING AS (VALUE:c12::STRING) ) with LOCATION = @my_aws_stage AUTO_REFRESH = FALSE FILE_FORMAT = (format_name = CSV_FF); |
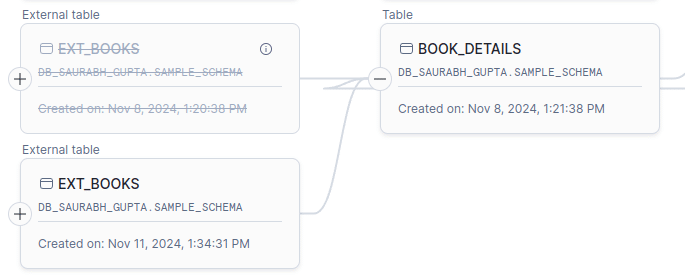
And then I used the External Table in a CTAS
|
1 2 3 4 5 6 |
CREATE OR REPLACE TABLE NEW_HORROR_MOVIE AS SELECT * FROM ext_netflix_titles WHERE TYPE = 'Movie' AND RELEASE_YEAR > 2019 AND LISTED_IN LIKE '%Horror Movies%'; |
My expectation was that the staged CSV file would be the base source for the target table. However, for both direct and base source, it was the external table.
Example: Data lineage for COPY INTO
|
1 2 3 4 |
COPY INTO movie_titles FROM @my_aws_stage FILE_FORMAT = (TYPE = 'CSV' FIELD_OPTIONALLY_ENCLOSED_BY='"' SKIP_HEADER = 1 ERROR_ON_COLUMN_COUNT_MISMATCH=FALSE) ON_ERROR = 'CONTINUE'; |
I expected the staged CSV file to be the source for the target table. However, for both base and direct sources, it was NULL
Example: Data lineage for JSON
In this example, we’re interested if the data lineage traces the path of the JSON elements or just uses the name of the column the JSON document was stored in.
|
1 2 3 4 5 6 7 8 9 10 11 12 |
INSERT INTO INT_MUSICAL_INSTRUMENT (reviewer_id, asin, reviewer_name, helpful_yes, helpful_no, review_text, overall_rating, summary, review_time) SELECT SRC:reviewerID::STRING AS reviewer_id, SRC:asin::STRING AS asin, SRC:reviewerName::STRING AS reviewer_name, SRC:helpful[0]::INT AS helpful_yes, SRC:helpful[1]::INT AS helpful_no, SRC:reviewText::STRING AS review_text, SRC:overall::FLOAT AS overall_rating, SRC:summary::STRING AS summary, TO_TIMESTAMP(SRC:unixReviewTime::INT) AS review_time FROM Musical_instrument; |
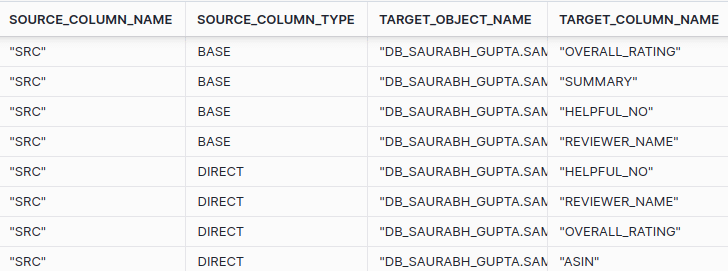
As you can see, data lineage did not trace the path to the JSON element, it just referenced the name of the source column where the JSON document is stored.
Example: Data lineage WHERE EXISTS
|
1 2 3 4 5 6 7 |
UPDATE EMPLOYEE_DETAILS_SRC SET Salary = Salary * 1.20 WHERE EXISTS ( SELECT * FROM EMPLOYEE_DETAILS_SRC e WHERE e.Department = 'Engineering' AND e.Employee_ID = EMPLOYEE_DETAILS_SRC.Employee_ID ); |
The result
The indirect lineage in WHERE EXISTS is not recorded
Example: Data lineage Dynamic Tables
I created a Dynamic Table for this example
|
1 2 3 4 5 6 7 8 9 10 11 |
CREATE OR REPLACE DYNAMIC TABLE Employee_Summary TARGET_LAG = '10 minute' WAREHOUSE = 'VWH_SAURABH_GUPTA' AS SELECT Department, COUNT(*) as Employee_Count, AVG(Salary) as Avg_Salary, MIN(Hire_Date) as Earliest_Hire_Date FROM EMPLOYEE_DETAILS_SRC GROUP BY Department; |
I then checked ACCESS_HISTORY.
Column OBJECTS_MODIFIED was NULL.
Data lineage for Dynamic Tables is not available in ACCESS_HISTORY.
Example: Data lineage Materialised Views
Data lineage for Materialised Views is not available in ACCESS_HISTORY.
Snowflake table level lineage
Data lineage at the table level isn’t available in ACCESS_HISTORY as a separate feature.
However, column level lineage is more granular than table level lineage and you can derive table level lineage from column level lineage stored in ACCESS_HISTORY.OBJECTS_MODIFIED.
I have modified the data lineage query provided by Snowflake to only list table level lineage objects.
|
1 2 3 4 5 6 7 8 9 10 11 12 13 14 15 16 17 18 19 20 21 22 23 24 25 26 27 28 29 30 31 32 33 34 35 36 37 38 39 40 41 42 43 44 45 46 47 48 49 50 51 52 53 |
// 1 select distinct Source_object_id, source_object_name, Source_column_type, target_object_name from ( select directSources.value: "objectId" as source_object_id, directSources.value: "objectName" as source_object_name, directSources.value: "columnName" as source_column_name, 'DIRECT' as source_column_type, om.value: "objectName" as target_object_name, columns_modified.value: "columnName" as target_column_name from ( select * from snowflake.account_usage.access_history ) t, lateral flatten(input => t.OBJECTS_MODIFIED) om, lateral flatten(input => om.value: "columns", outer => true) columns_modified, lateral flatten( input => columns_modified.value: "directSources", outer => true ) directSources union // 2 select baseSources.value: "objectId" as source_object_id, baseSources.value: "objectName" as source_object_name, baseSources.value: "columnName" as source_column_name, 'BASE' as source_column_type, om.value: "objectName" as target_object_name, columns_modified.value: "columnName" as target_column_name from ( select * from snowflake.account_usage.access_history ) t, lateral flatten(input => t.OBJECTS_MODIFIED) om, lateral flatten(input => om.value: "columns", outer => true) columns_modified, lateral flatten( input => columns_modified.value: "baseSources", outer => true ) baseSources ) |
Here is an example of what the result looks like
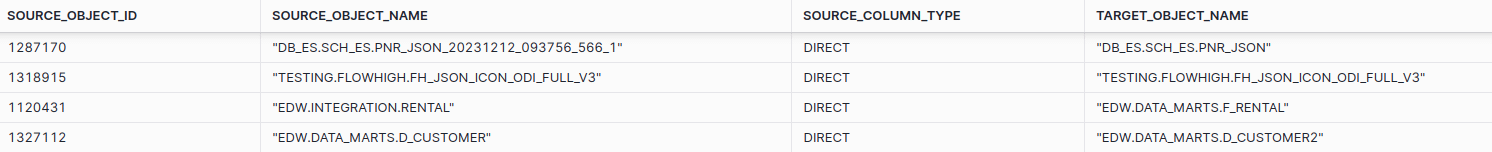
The query only lists the source and target objects without columns and column level lineage.
End to end Snowflake data lineage
Using the source table to target table mappings stored in ACCESS_HISTORY.OBEJCTS_MODIFIED, you can build your own end to end data lineage solution.
This is a non-trivial exercise, and you’re probably better off using a new feature that visualises Snowflake data lineage in Snowsight.
Here are the steps to build your own solution.
- Flatten column OBJECTS_MODIFIED for all relevant queries.
- Identify any root objects, i.e. source object IDs without a parent.
- Use the object IDs of source columns, source tables, target columns and target tables to recursively iterate over the hierarchy.
At a high level these are the steps. However, it is much harder to get a working solution. I recommend to either use the visual Data Lineage feature in Snowsight or to use a third party data lineage tool.
Snowflake tag lineage
Closely related to data lineage is the concept of tag lineage. In Snowflake, tag lineage refers to inheritance of a tag in the Snowflake object hierarchy.
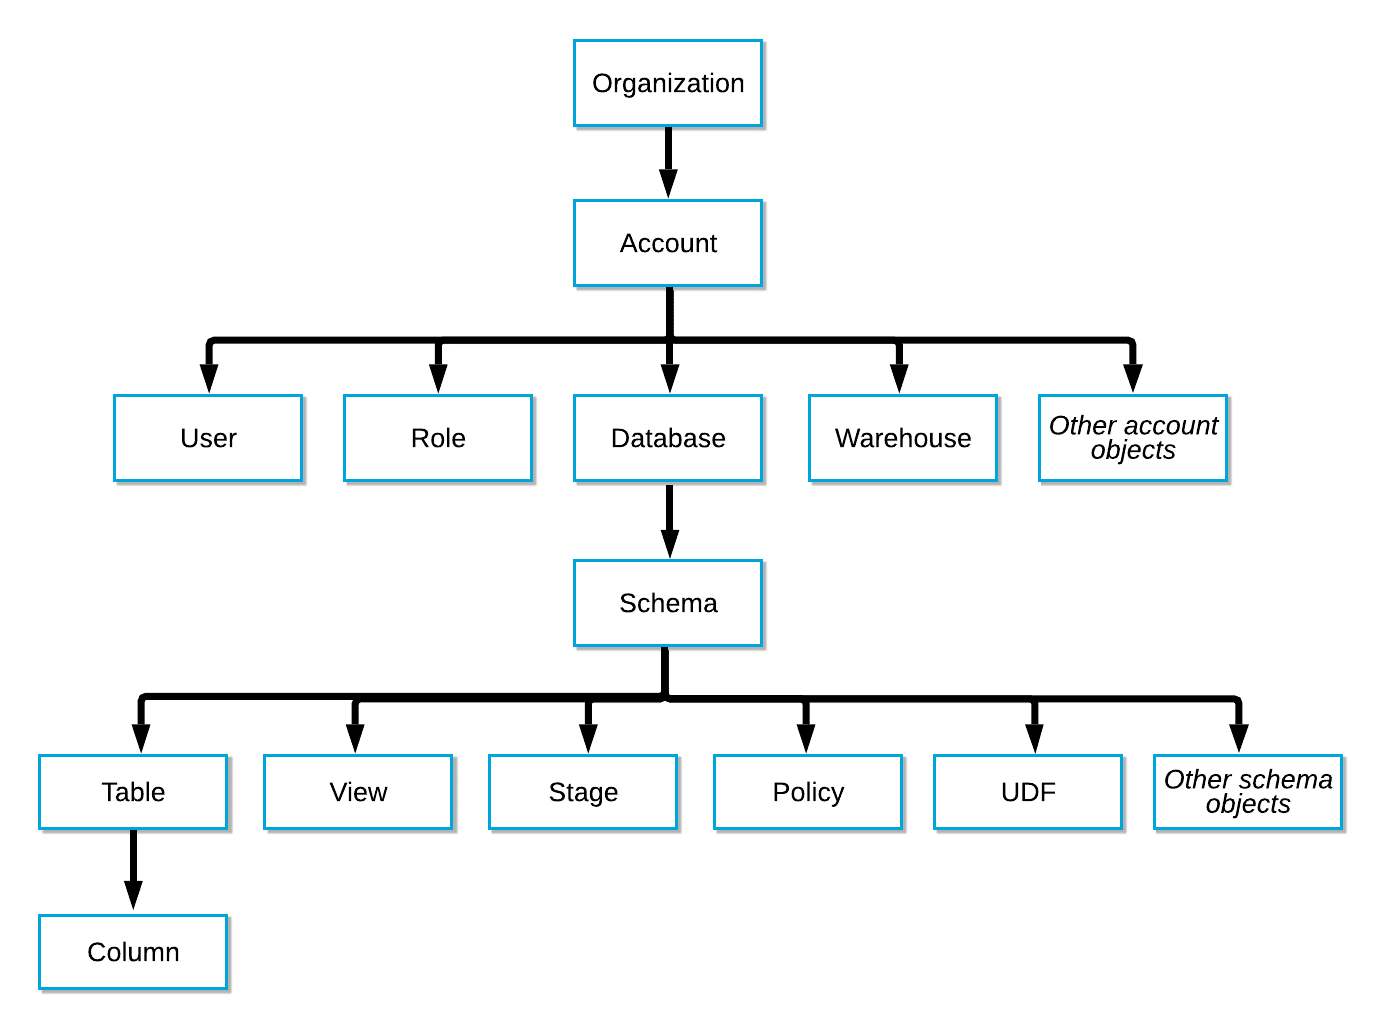
Snowflake object hierarchy
If you create a Snowflake tag at a higher level of the object hierarchy, it will automatically be applied at lower levels of the hierarchy including children, grandchildren, great grandchildren, and so on.
Creating a tag at the Account level will also apply this tag to any downstream objects, such as Database, Schema, Table, View, Stage, Column, and so on. However, you can manually override tag inheritance at a lower level of the hierarchy if you want to.
Examples tag lineage
- Example 1 – tag lineage: When you create a tag on a schema it will automatically be inherited by a table inside this schema.
- Example 2 – tag lineage: When you create a tag on a table it will automatically be inherited by all columns of the table
Snowflake automatic tag propagation
You shouldn’t confuse Snowflake tag lineage with Snowflake automatic tag propagation. They are not the same thing.
Automatic tag propagation ensures that metadata tags (e.g., “PII”, “Sensitive”) applied to data at the source level stay with the data through all transformations, aggregations, and transfers in a data pipeline. This capability is useful for maintaining compliance and governance as data flows through complex ETL steps.
Note
Automatic tag propagation was announced at Snowflake Summit June 2024. It is currently in private preview
Example automatic tag propagation
Imagine a data pipeline with three stages, each represented by a permanent table:
- raw_customer_data: A table that stores raw, unprocessed customer data ingested from an external source.
- staging_customer_data: A table where data is processed while referencing raw_customer_data.
- final_customer_data: The final table storing processed customer data used in reporting, derived from staging_customer_data.
raw_customer_data >> staging_customer_date >> final_customer_data
Let’s assume we need to tag sensitive information in this pipeline. We’ll apply a PII (Personally Identifiable Information) tag to the customer_email column in the raw_customer_data table to identify it as sensitive.
The staging_customer_data table references customer_email from raw_customer_data during the transformation process.
The PII tag applied to customer_email in raw_customer_data will automatically propagate to customer_email in staging_customer_data.
Benefits of automatic tag propagation
- Consistent Tagging: Automatically applies tags across related data objects, keeping everything consistent.
- Better Security & Compliance: Helps meet privacy regulations by tagging sensitive data throughout the pipeline.
- Less Manual Work: Reduces effort by avoiding repetitive tagging tasks.
- Scalable: Supports large environments with many tables and views.
- Trustworthy Data: Builds confidence that sensitive data is well-managed.
Snowflake ML Lineage
The first time I looked at Snowflake ML Lineage, I was a bit confused. At first I thought it was a completely separate feature from Data Lineage in Snowsight. But I quickly realised that it extends the Data Lineage feature in Snowsight with Snowflake machine learning objects such as models.
So what exactly is Snowflake ML Lineage?
You can trace the flow of data through machine learning pipelines using ML Lineage. It gives you a map of the relationships and dependencies between the various data objects used in ML workflows inside Snowflake.
What is captured in Snowflake ML Lineage?
Apart from standard database objects such as tables, stages, views etc. you can also visualise ML objects in the Snowsight lineage UI.
- A Feature View contains the machine learning features for model training. You build a feature view on top of a DataFrame, which captures the business transformation logic for the features.
- Data set objects
- Model objects
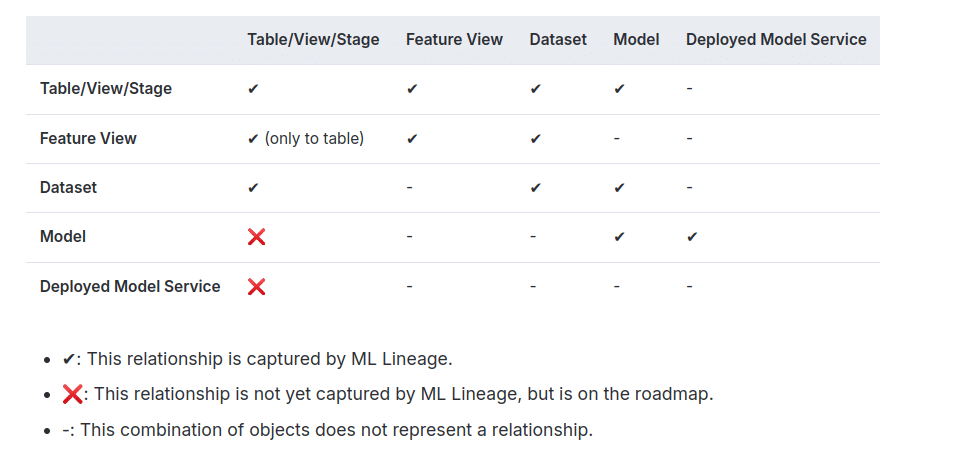
Here is an overview of what is tracked from the Snowflake docs
Did you know?
Under the hood, a Feature View is a “standard” database object. If managed by Snowflake it uses a Dynamic Table. If the refresh is managed externally, it uses a View.
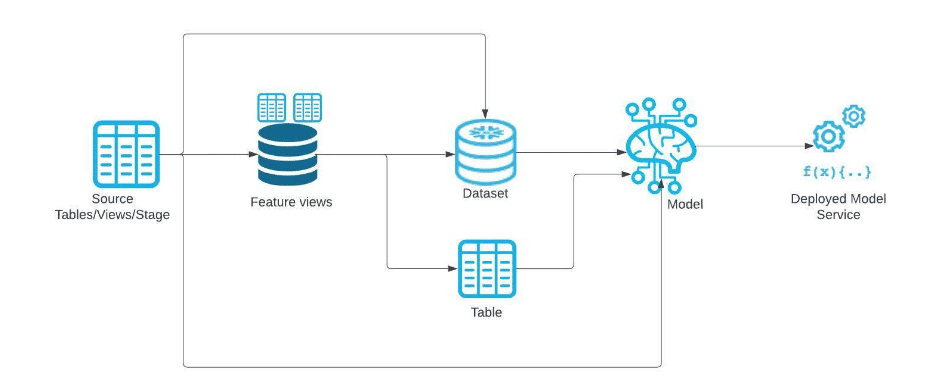
The lineage captures various types of relationships between these artefacts, including:
- Data flow relationships (e.g., from source tables to feature views)
- Model training relationships (e.g., from datasets to registered models)
- Model deployment relationships (e.g., from registered models to deployed services)
- Cloning relationships between similar artefacts
Check this matrix from the Snowflake docs for the possible relationships (as of Nov 2024).
Can I capture lineage for non-Snowpark DataFrames?
Yes, but this is a manual process.
You can use the Model Registry’s log_model method to add lineage information from non-Snowpark sources. You pass a DataFrame that is backed by a table with this method.
The following objects can be added to the model registry this way.
- Training a model in Snowpark ML using data from sources like a pandas DataFrame.
- Training a model without Snowpark ML or a Snowpark DataFrame.
- Training a model outside of Snowflake
Here is an example of using log_model with a Pandas DataFrame
|
1 2 3 4 5 6 7 8 |
reg = Registry(session=sp_session, database_name="ML", schema_name="REGISTRY") mv = reg.log_model(my_model_pipeline, model_name="my_custom_model_pipeline", version_name="v1", conda_dependencies=["scikit-learn"], comment="My Custom ML Model Pipeline", sample_input_data=train_features) output_df = mv.run(input_df) |
How can you access Snowflake ML Lineage?
You can access Snowflake ML Lineage through the Data Lineage UI in Snowsight.
You navigate to the object’s catalog page and then go to the Data Lineage tab.
Aside from the UI, Snowflake ML Lineage also includes methods to access lineage from the ML API. I’ll cover the API and various other options in a separate section about programmatic access later in the blog.
What are the benefits of Snowflake ML Lineage?
The benefits of Snowflake ML Lineage are similar to the general benefits you’ll get from an automated data lineage solution. Here are some of the benefits thatSnowflake ML Lineage provides.
- Automated Tracking: Snowflake automatically captures and maintains data lineage information, eliminating the need for manual tracking and making it easier to follow data origins and transformations.
- Comprehensive Tracking: ML Lineage provides full traceability of data flow throughout the entire machine learning pipeline. It allows users to track connections between key components, like source tables, feature views, datasets, registered models, and deployed model services.
- Better Data Governance: By tracking ML lineage, you can apply data governance policies, standards, and controls more effectively. This supports regulatory compliance, helps monitor data quality, and enforces security and access protocols.
- Impact Analysis and Change Management: ML Lineage allows you to assess the impact of changes to data structures, transformations, or processes. This helps you identify which systems, reports, or analyses could be affected, supporting better planning and risk management.
Snowflake lineage UI
Snowflake has introduced Data Lineage as a new feature in Snowsight. You can now view data lineage as a visual diagram directly in the UI.
Snowsight lineage supports the following DML operations
- CREATE TABLE … AS SELECT (CTAS)
- CREATE TABLE … CLONE
- CREATE VIEW
- CREATE MATERIALIZED VIEW
- INSERT … SELECT …
- MERGE
- UPDATE
It supports the following objects:
- Table
- Dynamic table
- External table
- View
- Materialised view
- Stage
- Feature view
- Dataset
- Model
Note
As of November 2024 the Snowflake Data Lineage UI is in public preview.
Snowsight Data lineage also supports machine learning-specific objects, such as Models, Datasets, and Feature Views, in addition to standard database objects like Tables, Views Dynamic Tables.
Data lineage in Snowsight – Objects in the hood
Snowsight visualises data lineage using a neighbourhood view approach.
What is a neighbourhood view?
A neighbourhood view shows only the objects directly connected to the selected data object, (aka the anchor node), as its “neighbours” instead of showing the entire data pipeline, which can often be complex and overwhelming.
This view highlights:
- Upstream Dependencies: Objects that feed data into the current object.
- Downstream Dependencies: Objects that rely on data from the current object.
While the neighbourhood view initially displays only one level of dependencies (one “hop” away), it allows users to expand upstream and downstream connections beyond the first level (or “hop”). By clicking on a data object’s “neighbours”, users can incrementally explore the lineage, expanding the view as needed to trace data flow further up or down the pipeline.
Accessing visual data lineage
Accessing data lineage in Snowsight is straightforward, but you need to make sure that your users have the right permissions.
- Any privilege on the objects for which you want to evaluate the lineage, such as SELECT on a table.
- USAGE on the database and schema that contains the object.
- VIEW LINEAGE on the account.
Let’s go through an example.
In Snowsight go to Databases > Schema > Tables. Go to a table’s catalog page where you’ll find the Lineage tab.
You’ll need to select a virtual warehouse to display the lineage diagram. Visualising the lineage graph in a UI creates computing costs.
There are nodes on the diagram that represent the supported data sets (tables, views, dynamic tables etc). Edges in the lineage diagram show the dependencies between nodes. You can display the SQL that is used to write to the node such as a table by clicking on an edge..
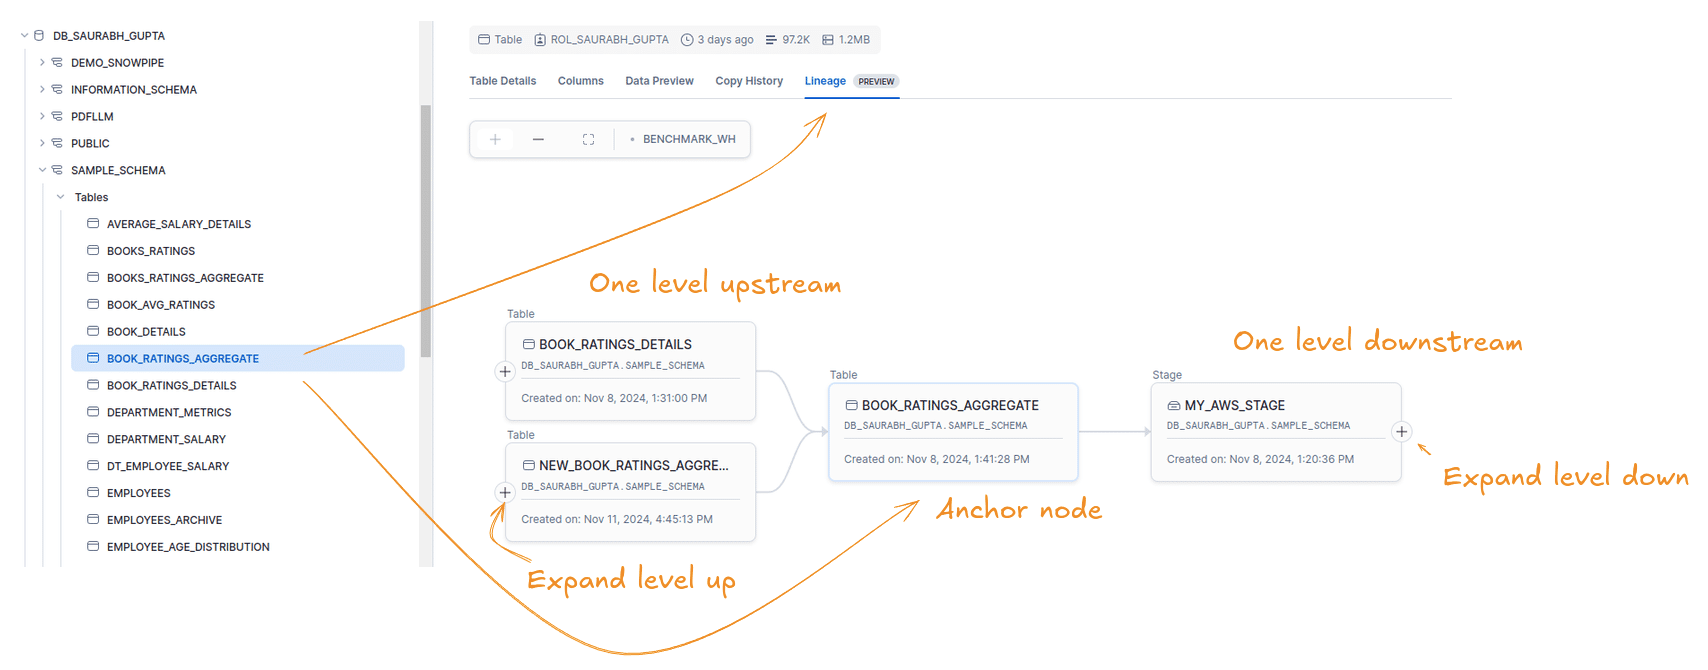
In this example we selected the table BOOK_RATINGS_AGGREGATE as the anchor node.
- Tables BOOK_RATING_DETAILS and NEW_BOOK_RATINGS_AGGREGATE are one level up from the anchor node.
- Stage My_AWS_Stage is one level downstream from BOOK_RATINGS_AGGREGATE
- We can zoom in and out of the graph.
Write operations to tables are shown as edges rather than separate nodes. This setup makes it difficult to determine if upstream tables are used in one or multiple SQL statements to load a table.
For example, in the figure above BOOK_RATINGS_DETAILS and NEW_BOOK_RATINGS_AGGREGATE are used in two separate SQL statements. Just looking at the diagram won’t tell you this. You’ll need to click on the edge itself to get this info.
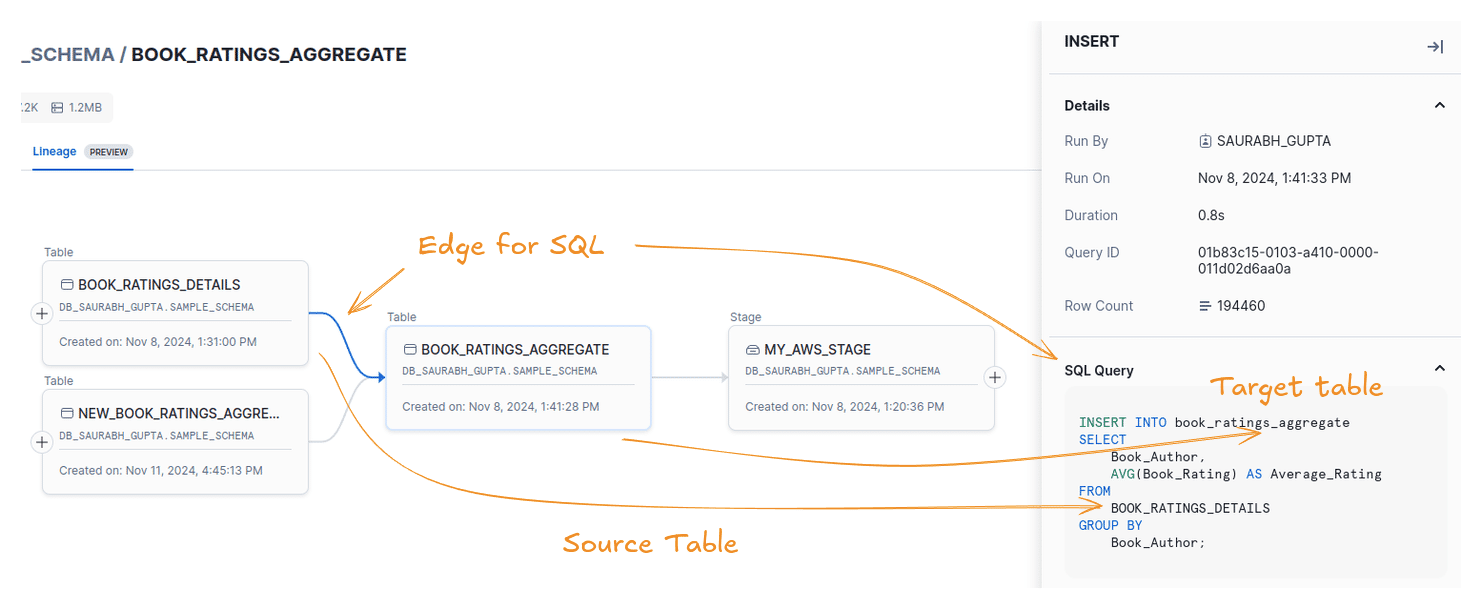
- Clicking on the edge that connects BOOK_RATING_DETAILS to BOOK_RATINGS_AGGREGATE shows the SQL that is used to load the target from the source table.
- Other details such as the user who ran the query, a timestamp, the duration, the query ID, and the row count of the source table are also displayed.
We noticed that for Views, Materialised Views, and Dynamic Tables the edges are not clickable and the SQL is not displayed.
Clicking on a table shows additional information such as the owner, comments, tags, the row count of this table, and the timestamp of when it was created.
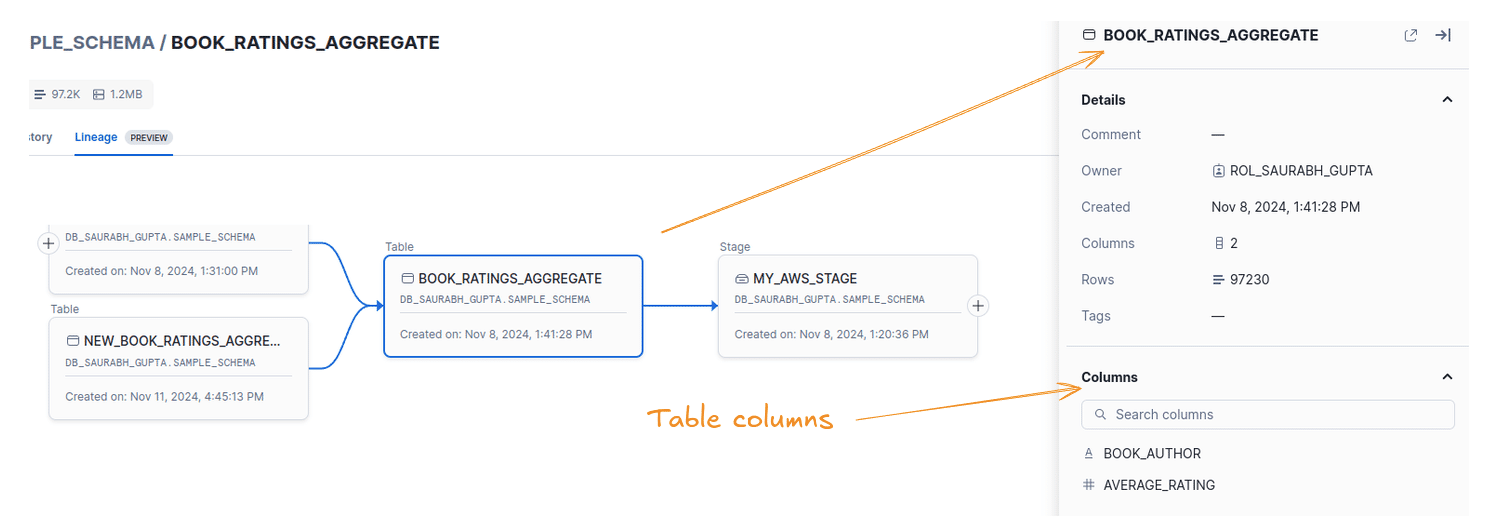
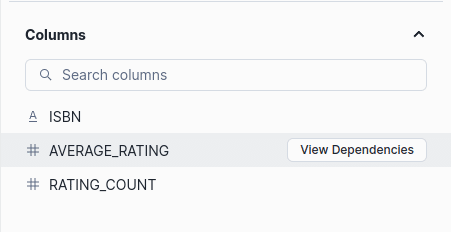
The table’s columns are also shown.
Snowflake column level lineage in UI
You can show the lineage upstream and downstream for each column
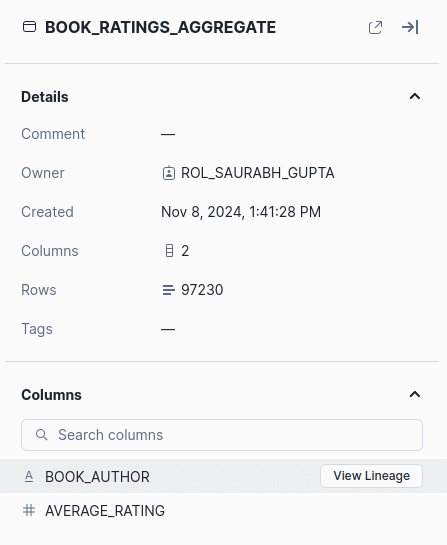
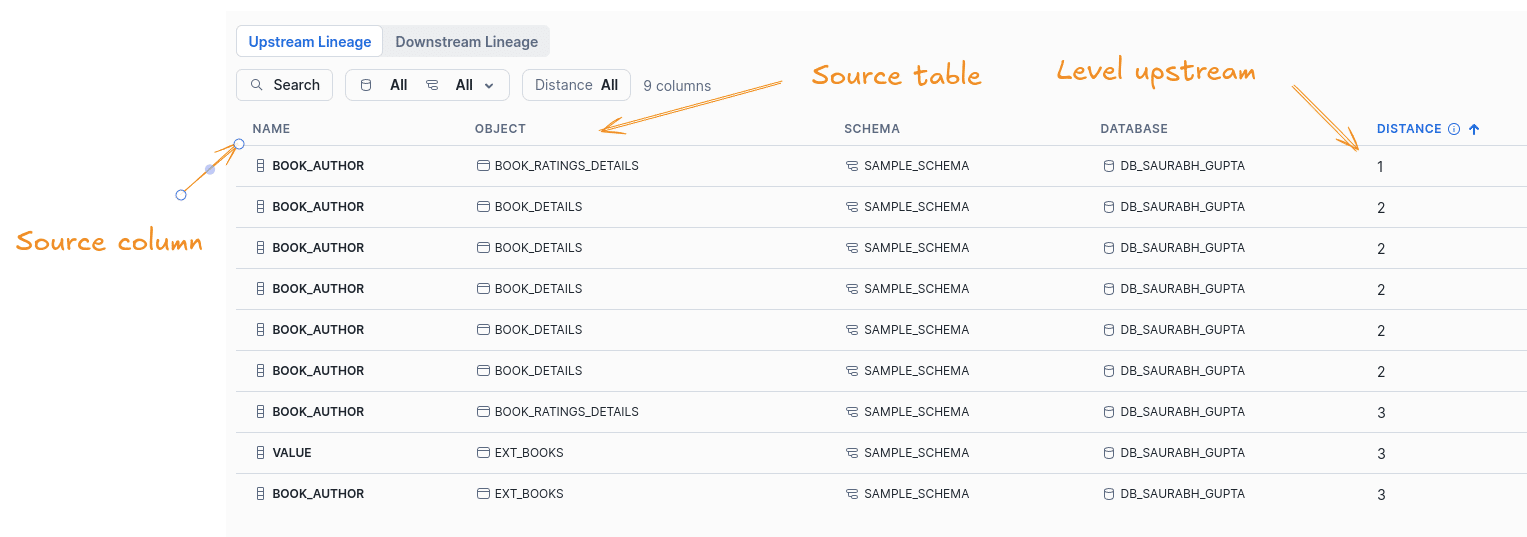
Clicking on View Lineage will show Upstream and Downstream Lineage in a tabular format. The two types of lineage are shown on separate tabs.
The tabular information shows the node of the upstream or downstream object, the column name, the schema, the database, and the distance. The distance specifies how far the column is away from the anchor column in levels up or down or “hops”, if you will.
You can filter and search for columns.
There is no visual diagram displayed for column level lineage and column level mappings as there is very little value in visualising this information. The visualisation would get too crowdedFor larger data pipelines anyway.
Now we’ll go through an example on how column lineage works.
I’ve picked column BOOK_AUTHOR in table BOOK_RATINGS_AGGREGATE and moved to the Upstream Lineage tab.
Checking one level upstream I can see a dependency on BOOK_AUTHOR in table BOOK_RATINGS_DETAILS
Deleted objects
Deleted objects, such as a dropped table, are shown for 14 days.
Object dependencies
Apart from viewing lineage, you can also visualise object dependencies inside Snowsight’s visual lineage feature.
Object dependency in databases refers to the relationship between different database objects (such as tables, views, or stored procedures) where one object relies on another to function. For example, when a view depends on other views, that view is built using data from one or more upstream views, forming a chain of dependencies.
Snowflake supports the following object dependencies
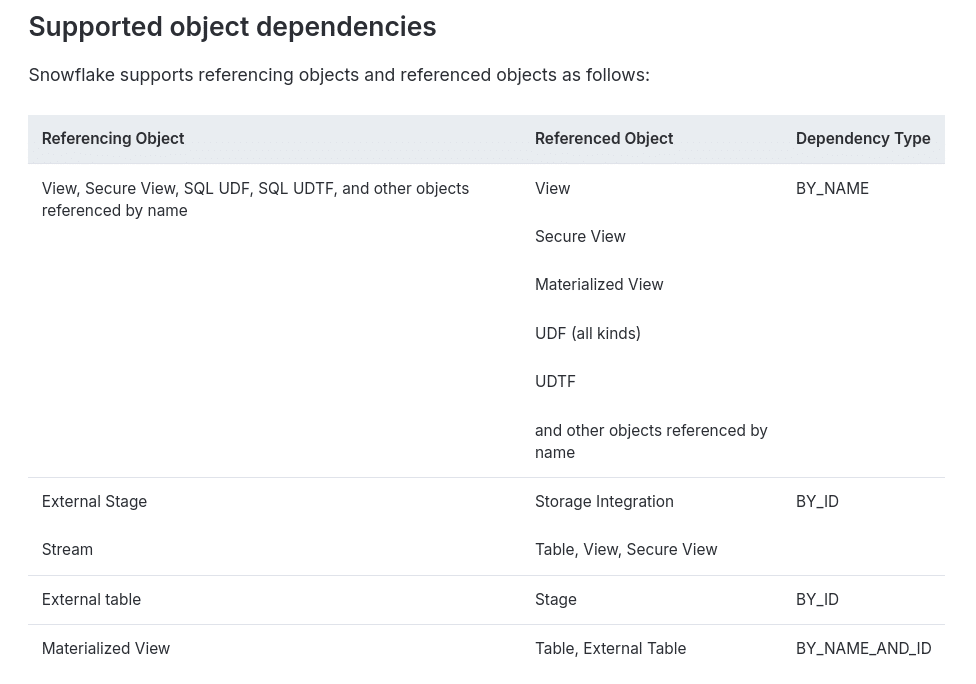
You can visualise these object dependencies from the UI by selecting Show only dependencies.
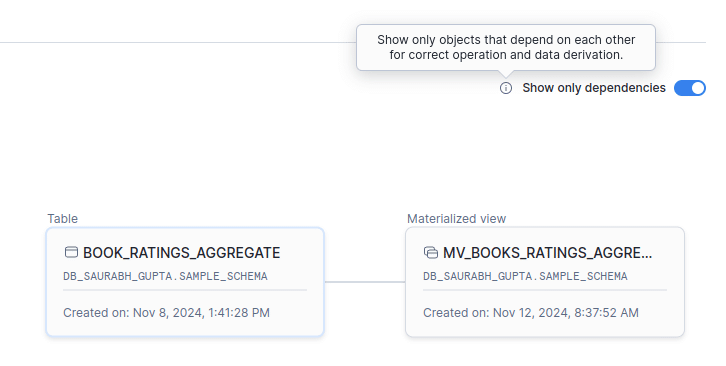
In the above example, the Materialised View MV_BOOKS_RATINGS_AGGREGATE depends on the table object BOOK_RATINGS_AGGREGATE.
Object dependencies are also available at the column level.
Gotchas of neighbourhood view
When using the lineage visualisation in Snowflake, you must understand that the graph is based on what’s called a “neighbourhood view” where only the immediate connections, or “dependencies”, of the selected table (called the “anchor node”) are shown.
When you select a table, Snowflake shows the direct lineage for that table (one level up or down), rather than the entire data pipeline. This approach is practical, as displaying a large data pipeline with thousands of tables would be overwhelming and hard to read.
Keep these key points in mind when working with the neighbourhood view:
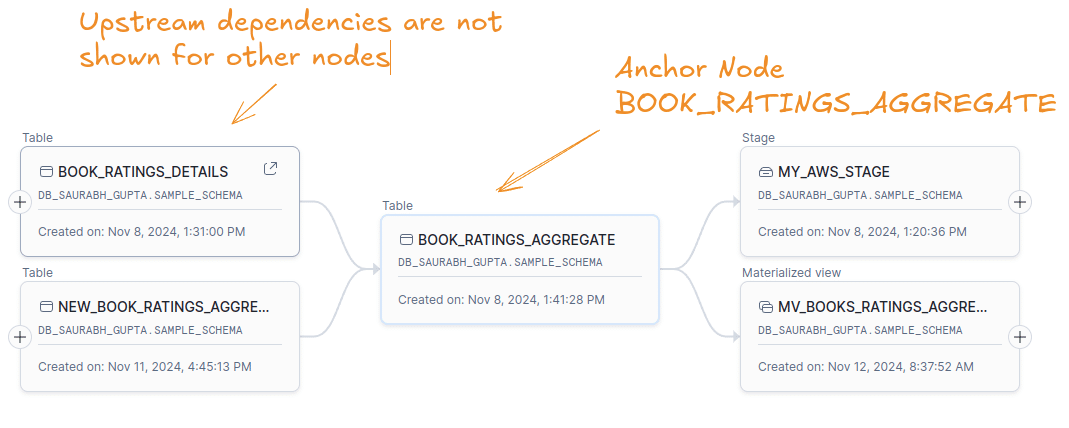
In this example, the selected node BOOK_RATINGS_AGGREGATE depends on another node, BOOK_RATINGS_DETAILS. The graph only shows the direct connections (upstream and downstream) of the selected node, BOOK_RATINGS_AGGREGATE. It doesn’t show any downstream connections of other nodes, like BOOK_RATINGS_DETAILS.
To see the connections of BOOK_RATINGS_DETAILS, we can make it the selected node and view its neighbourhood.
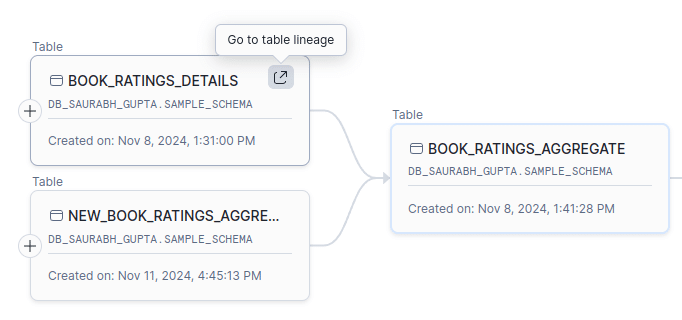
BOOK_RATINGS_DETAILS now is the anchor node.
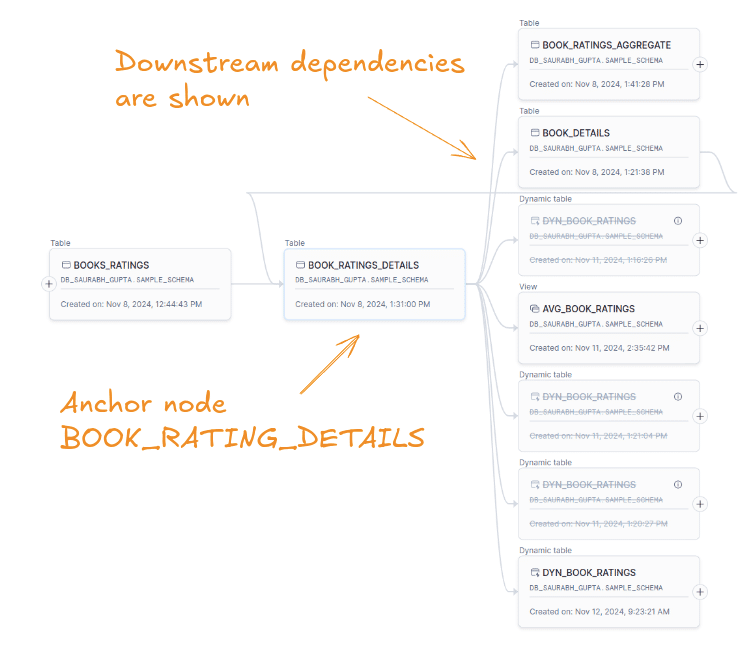
Now, the downstream dependencies for BOOK_RATINGS_DETAILS are shown, including its connection to BOOK_RATINGS_AGGREGATE and other downstream tables.
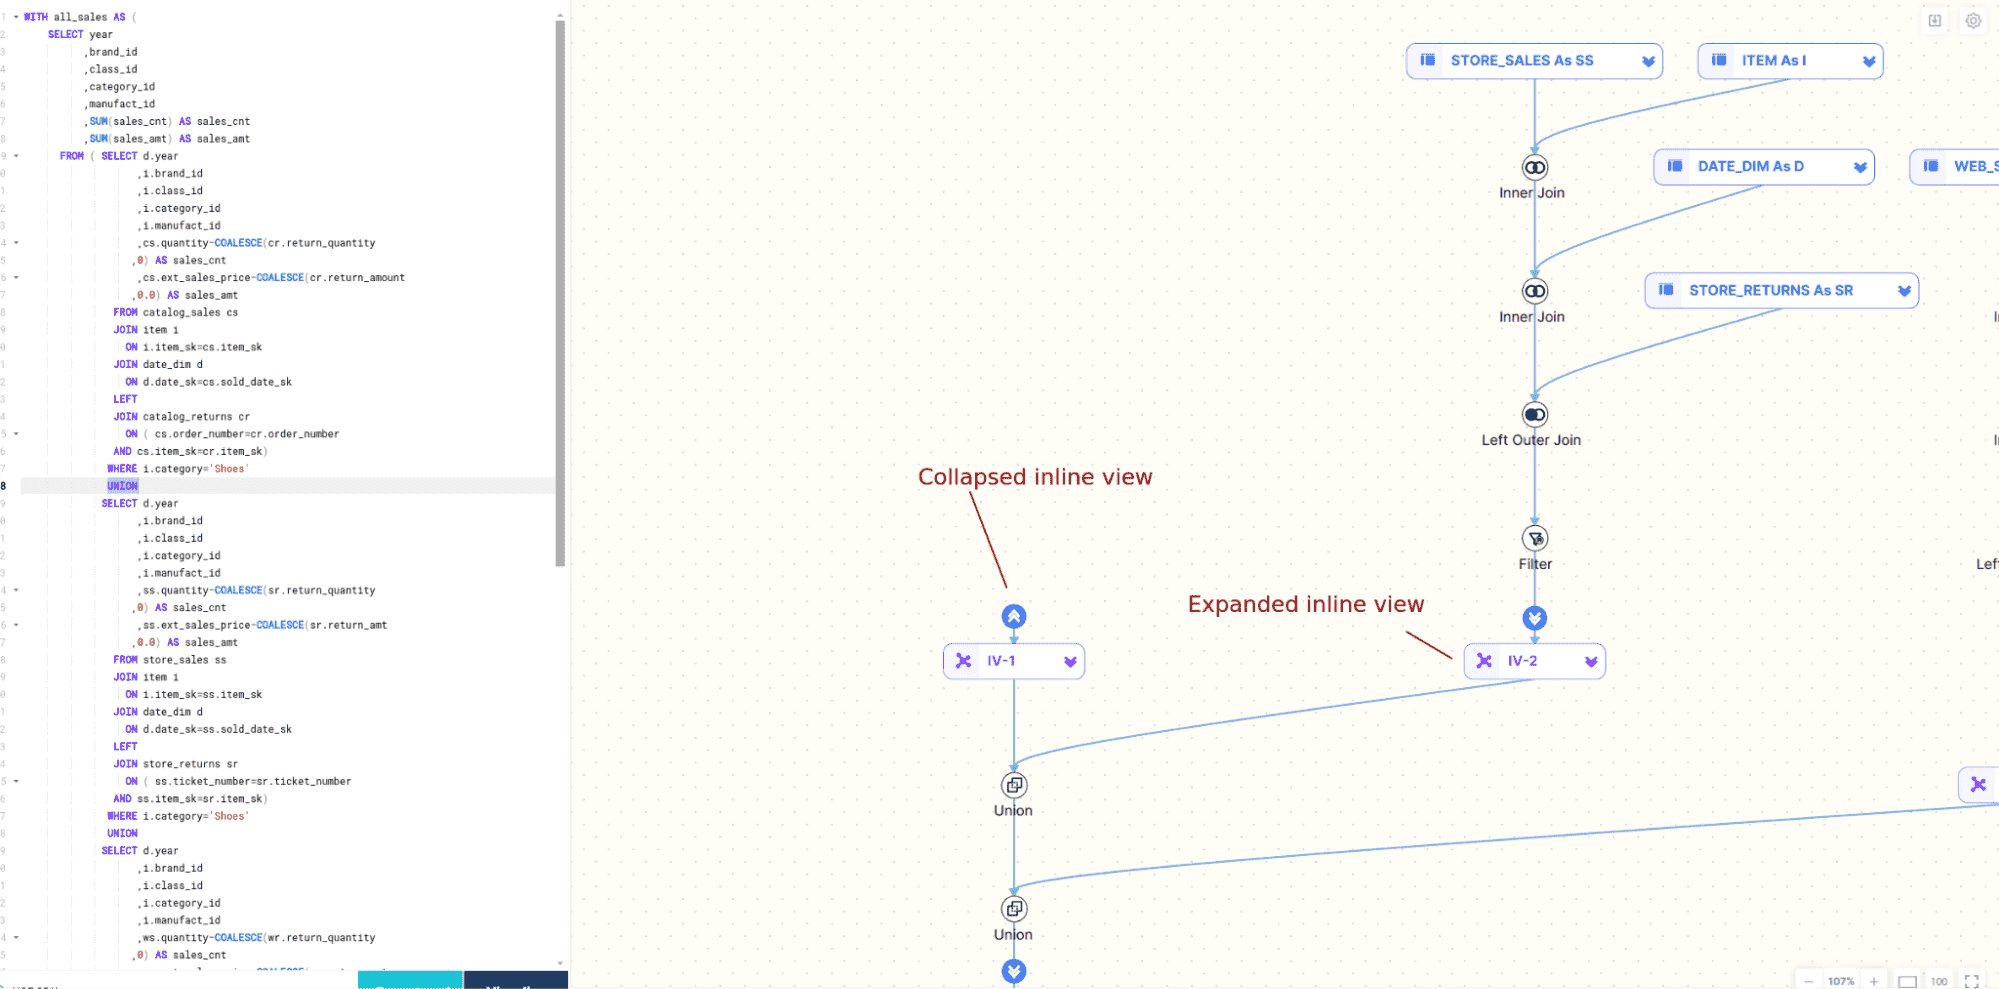
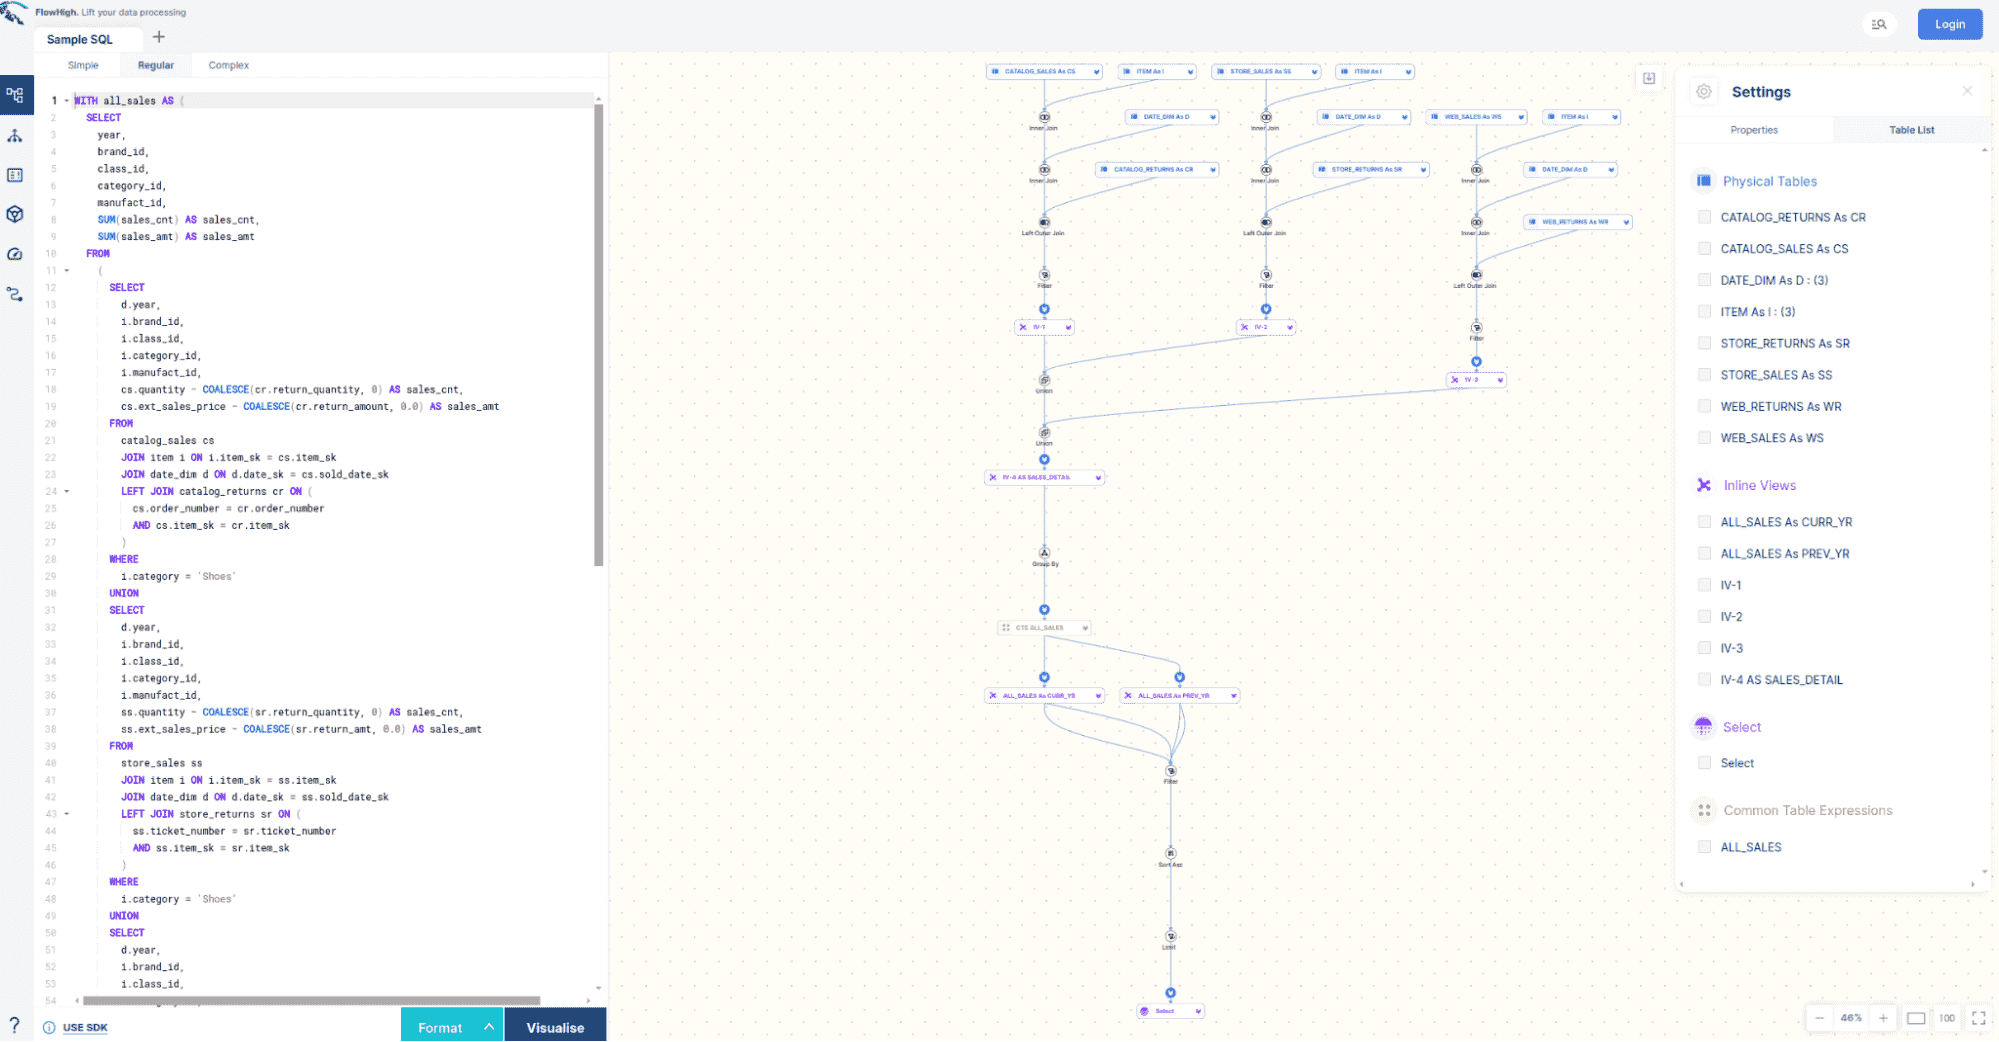
Visualising lineage from SQL query
While you can visualise the lineage of a data pipeline, Snowsight Data Lineage does not visualise the SQL query code.
Visualising SQL query code refers to the process of creating a graphical representation of a SQL query’s structure, data flow, and relationships between tables. This visualisation helps data engineers, data analysts, and database administrators better understand complex queries, optimise performance, and identify potential issues.
A tool for SQL query visualisation typically offers the following features:
- Query structure representation: The tool parses SQL code and displays its structure in a visual format, such as a tree diagram
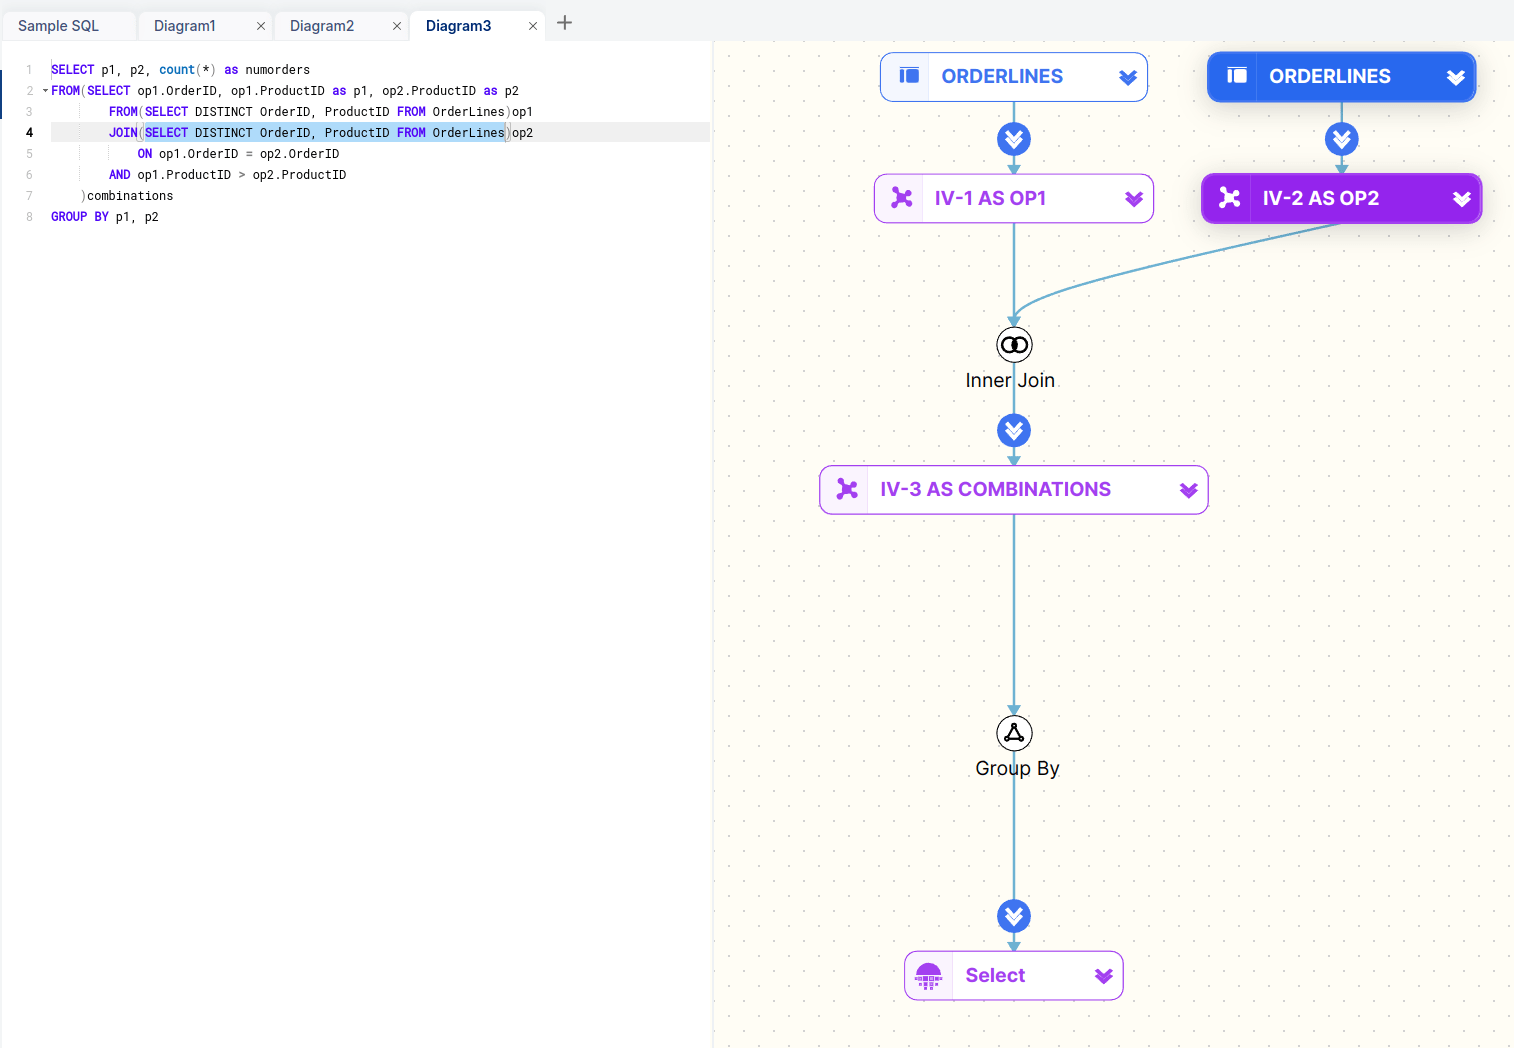
- Table and Join visualisation: It should show the tables involved in the query and how they are joined, clearly differentiating between INNER, LEFT, RIGHT, and FULL JOINs
- Subquery and CTE Handling: It should be capable of representing subqueries and Common Table Expressions (CTEs) in a nested or hierarchical manner.
- Interactive Elements: The ability to interact with the visualisation, such as expanding/collapsing sections or highlighting specific parts of the query.
Snowflake lineage API
You can access the Snowflake data lineage programmatically via SQL functions, Python API or the ML API.
In this section I get hands on and provide code samples for all three APIs.
I have created two pipelines. A standard pipeline and an ML pipeline with feature views, datasets and models.
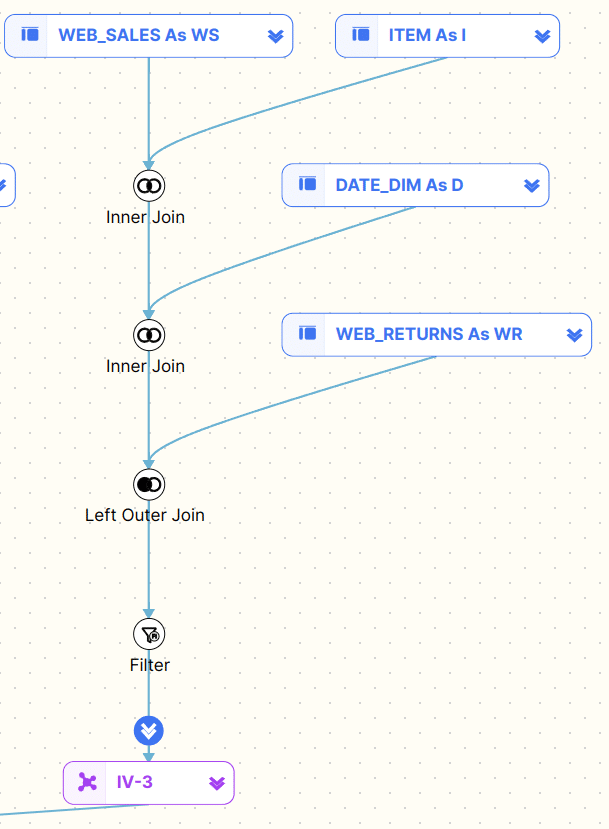
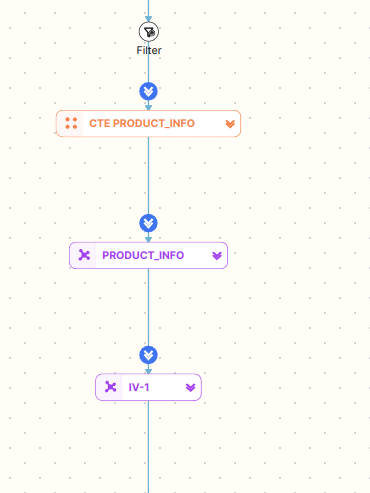
Here is the standard pipeline
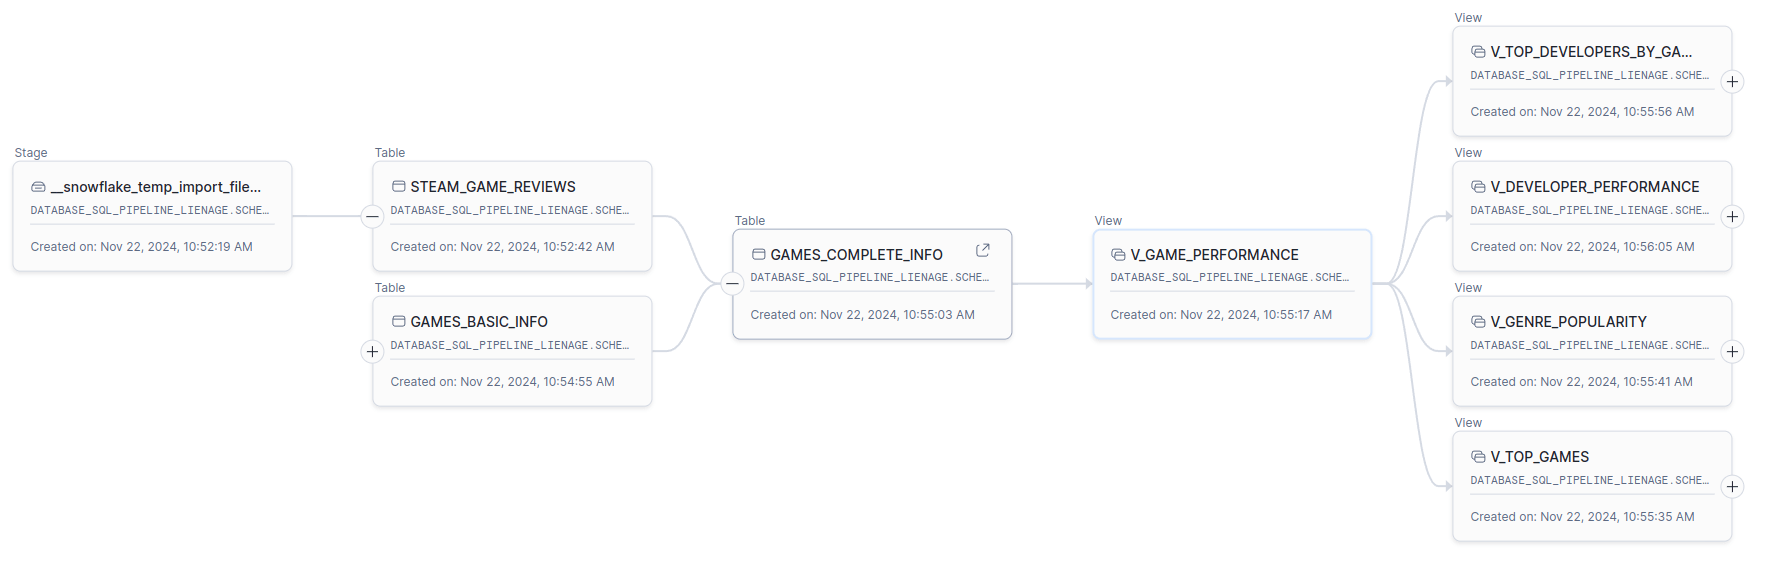
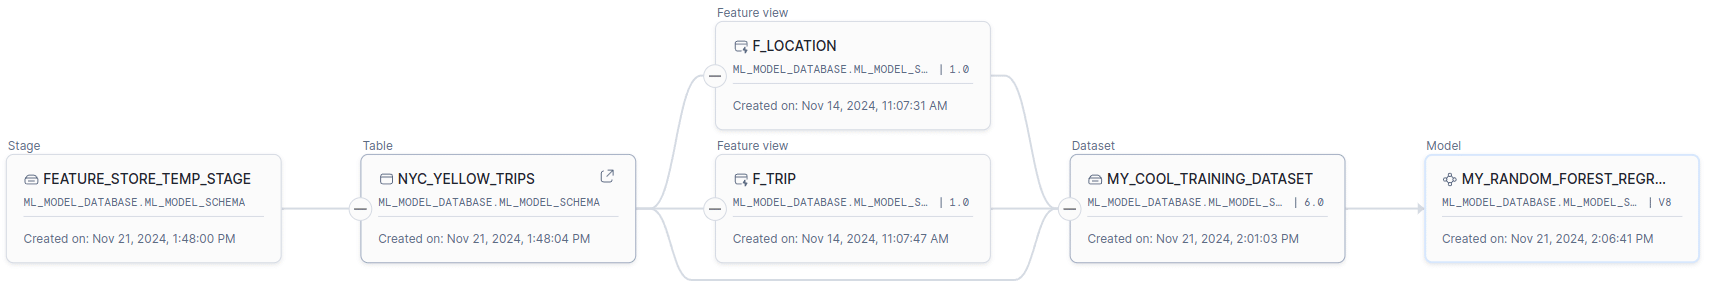
Here is the ML pipeline

Lineage with SQL function GET_LINEAGE
If you are mainly working with SQL then you will be happy to hear that Snowflake provides a table function that you can use directly from SQL to get data lineage information.
The GET_LINEAGE function retrieves data lineage information for a specified Snowflake object, showing its upstream or downstream relationships. Upstream lineage traces the sources that contributed to the creation of the object, while downstream lineage identifies objects that were created using the specified object. The function requires the object_name (with a fully qualified name if not in the current schema), object_domain (e.g., ‘COLUMN’, ‘TABLE’, ‘STAGE’), and direction (‘UPSTREAM’ or ‘DOWNSTREAM’). Optional arguments include distance (levels of lineage to retrieve, defaulting to 5) and object_version (for versioned objects like datasets or models). This function supports lineage tracking across diverse object types, including dynamic tables, views, feature views, and machine learning models.
It also works for ML pipelines and ML specific objects such as models, feature views and data sets.
Here are some code examples that show how GET_LINEAGE works
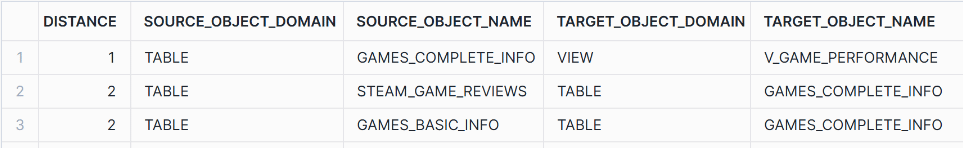
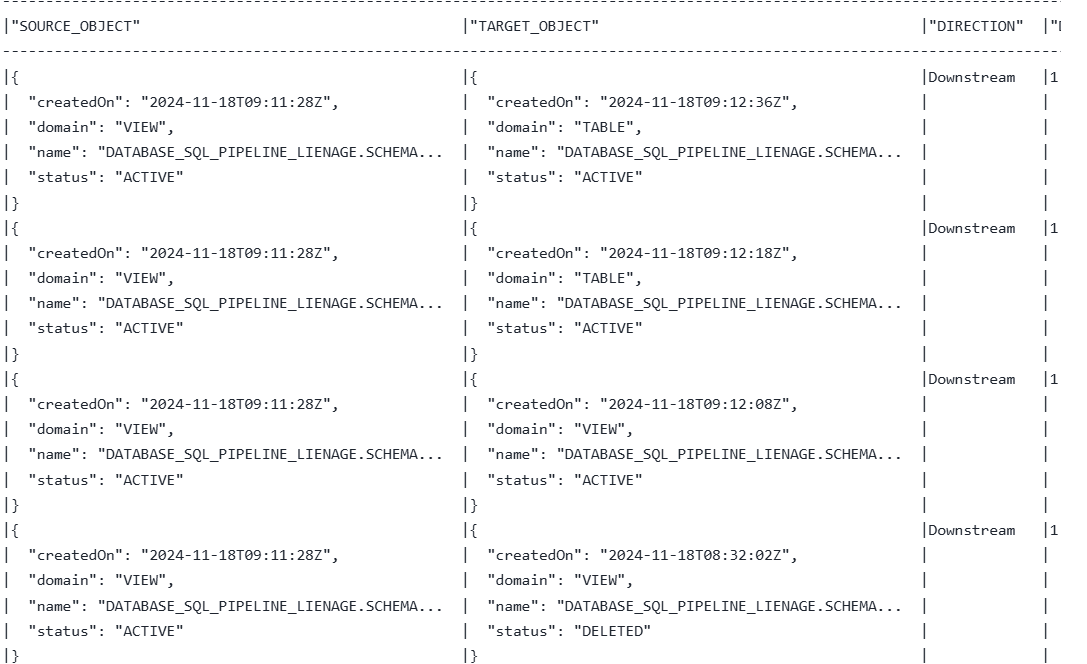
Example 1 – Standard data pipeline
The following SQL query retrieves the upstream dependencies of the V_GAME_PERFORMANCE view up to 2 levels.
|
1 2 3 4 5 6 7 8 9 10 11 12 13 14 |
SELECT DISTANCE, SOURCE_OBJECT_DOMAIN, SOURCE_OBJECT_NAME, TARGET_OBJECT_DOMAIN, TARGET_OBJECT_NAME FROM TABLE ( SNOWFLAKE.CORE.GET_LINEAGE( 'DATABASE_SQL_PIPELINE_LIENAGE.SCHEMA_SQL_PIPELINE_LIENAGE.V_GAME_PERFORMANCE', 'TABLE', 'UPSTREAM', 2 ) ); |
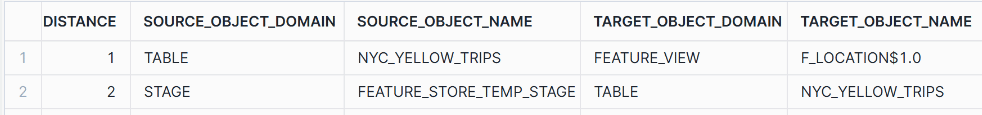
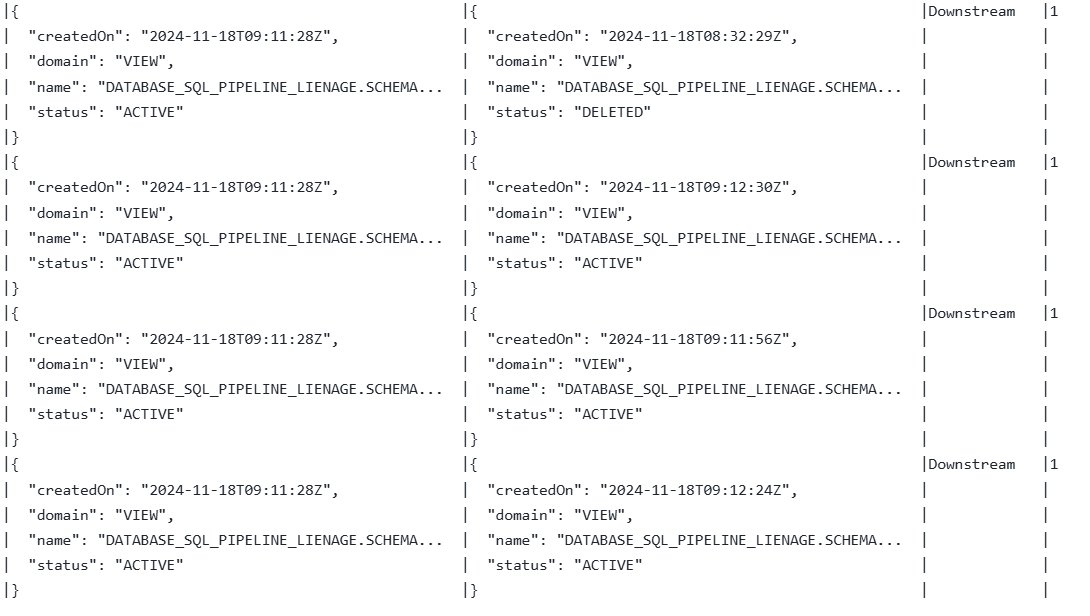
Example 2 – ML data pipeline
Upstream Dependency for F_LOCATION
|
1 2 3 4 5 6 7 8 9 10 11 12 13 14 |
SELECT DISTANCE, SOURCE_OBJECT_DOMAIN, SOURCE_OBJECT_NAME, TARGET_OBJECT_DOMAIN, TARGET_OBJECT_NAME, FROM TABLE( SNOWFLAKE.CORE.GET_LINEAGE( 'ML_MODEL_DATABASE.ML_MODEL_SCHEMA."F_LOCATION$1.0"', 'TABLE', 'UPSTREAM', 2 ) ); |
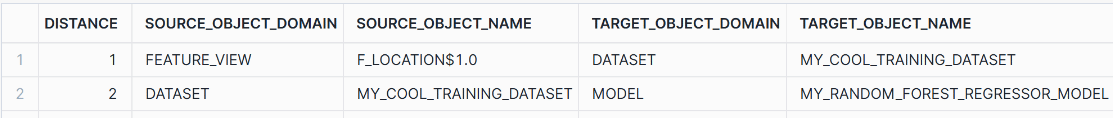
Downstream Dependency for F_LOCATION
|
1 2 3 4 5 6 7 8 9 10 11 12 13 14 |
SELECT DISTANCE, SOURCE_OBJECT_DOMAIN, SOURCE_OBJECT_NAME, TARGET_OBJECT_DOMAIN, TARGET_OBJECT_NAME, FROM TABLE( SNOWFLAKE.CORE.GET_LINEAGE( 'ML_MODEL_DATABASE.ML_MODEL_SCHEMA."F_LOCATION$1.0"', 'TABLE', 'DOWNSTREAM', 2 ) ); |
Lineage with Python API
If you are a data engineer and prefer Python over SQL, Snowflake has you covered as well.
Use LINEAGE and its trace method to get lineage for an object. Here is how it works.
The Lineage.trace method in Snowflake’s Snowpark library retrieves the lineage of a specified Snowflake object and returns the results as a DataFrame. It requires the fully qualified object_name (formatted as database.schema.object) and the object_domain (e.g., “table” or “view”). Optional parameters include object_version (for versioned objects like models or datasets), direction (UPSTREAM, DOWNSTREAM, or BOTH, defaulting to BOTH), and distance (the number of levels to trace, defaulting to 2, with a maximum of 10). The returned DataFrame includes details about the source, target, direction, and distance of the traced lineage, providing a structured view of data dependencies and relationships.
The Python API also works with ML objects.
Here are some examples.
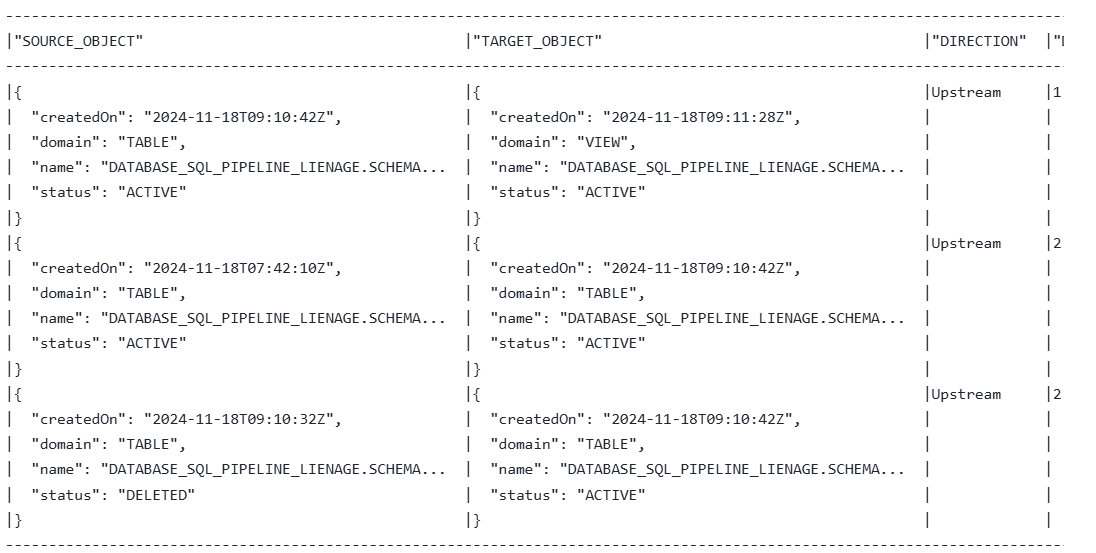
Example 1 – Standard data pipeline
The following Python code leverages Snowflake’s Snowpark library to trace both upstream and downstream dependencies of the V_GAME_PERFORMANCE view.
Setting up the Active Session
|
1 2 3 4 |
from snowflake.snowpark.context import get_active_session # Get the active session session = get_active_session() |
|
1 2 |
session.use_database("DATABASE_SQL_PIPELINE_LIENAGE") session.use_schema("SCHEMA_SQL_PIPELINE_LIENAGE") |
Upstream Dependency Using PythonLineage Function
|
1 2 3 4 5 6 7 8 |
db = "DATABASE_SQL_PIPELINE_LIENAGE" schema = "SCHEMA_SQL_PIPELINE_LIENAGE" lineage_df = session.lineage.trace( f"{db}.{schema}.V_GAME_PERFORMANCE", "view", direction="upstream" ) lineage_df.show() |
Downstream Dependency Using PythonLineage Function
|
1 2 3 4 5 6 7 8 |
db = "DATABASE_SQL_PIPELINE_LIENAGE" schema = "SCHEMA_SQL_PIPELINE_LIENAGE" lineage_df = session.lineage.trace( f"{db}.{schema}.V_GAME_PERFORMANCE", "view", direction="downstream" ) lineage_df.show() |
Example 2 – ML pipeline
Setting up the Active Session
|
1 2 3 4 5 6 7 8 9 |
from snowflake.snowpark.context import get_active_session session = get_active_session() # Set session context session.use_role("ML_MODEL_ROLE") session.use_database("ML_MODEL_DATABASE") session.use_schema("ML_MODEL_SCHEMA") print(f"role: {session.get_current_role()} | WH: {session.get_current_warehouse()} | DB.SCHEMA: {session.get_fully_qualified_current_schema()}") |
Upstream Dependency for F_LOCATION
|
1 2 3 4 5 6 |
df = session.lineage.trace( 'ML_MODEL_DATABASE.ML_MODEL_SCHEMA."F_LOCATION$1.0"', "table", direction="upstream", ) df.show() |
Lineage with ML API
The lineage method provided by the ML API works with objects of FeatureView, Model, and Dataset.
Here are some examples using lineage with the ML API.
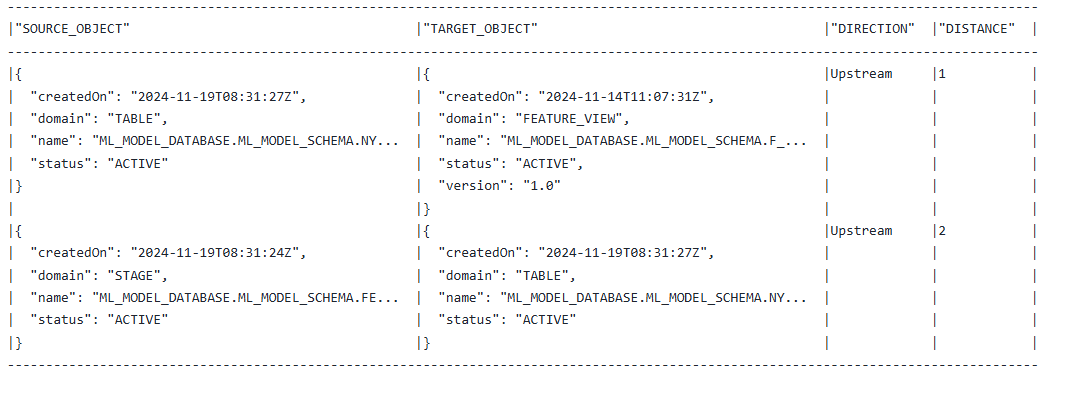
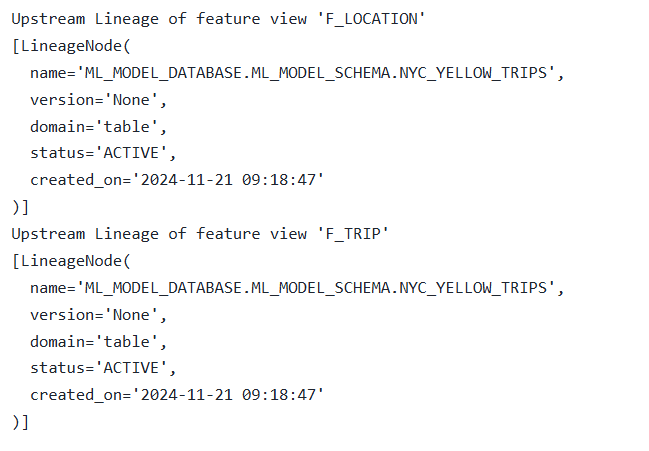
Example upstream Lineage feature view
We iterate over all feature views in our pipeline and print out the upstream lineage
|
1 2 3 |
for fv in all_feature_views: print("Upstream Lineage of feature view '" + fv.name + "'") print(fv.lineage(direction='upstream')) |
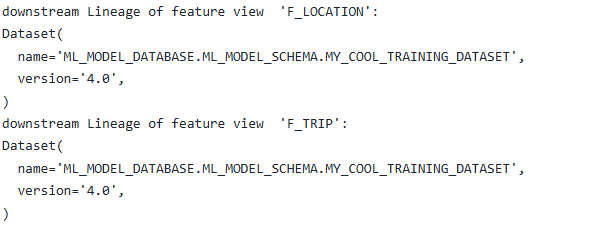
Example downstream lineage feature view
We iterate over all feature views in our pipeline and print out the downstream lineage
|
1 2 3 |
for fv in all_feature_views: print("downstream Lineage of feature view '" + fv.name + "'") print(fv.lineage(direction='downstream')) |
When do you need a data lineage tool?
I have covered everything you need to know about Snowflake native data lineage. Next I will give you some guidelines when Snowflake native lineage is enough and when you need to look at a third party data lineage tool.
Snowflake was the first data platform to offer native data lineage. It provides basic data lineage capabilities including a UI and programmatic access to data lineage through various APIs.
Here are some reasons you might need a third party data lineage tool:
- You need to visualise your whole data pipeline and not just view the neighbourhood for a selected anchor node / object.
- You have a requirement for automated change management and impact analysis. In a comprehensive impact analysis system, true impact analysis involves not only identifying upstream and downstream dependencies but also understanding the nature of changes and how they affect other objects in the data pipeline. Snowflake’s current lineage features can show dependencies but can’t provide the level of detail needed for full impact assessment.
- You need to go beyond 5 hops upstream or downstream in your dependency analysis.
- You need indirect lineage. Indirect lineage plays a crucial role in understanding how changes to one part of a data pipeline can affect downstream processes, even if those changes don’t directly map to a specific downstream column or object. For example, let’s say you modify a WHERE clause to filter a column based on certain criteria. While this column might not directly map to any columns in downstream tables, it still impacts the data itself that flows down the pipeline. For instance, if the filter excludes certain rows, any reports or analyses relying on this data will now reflect fewer records or potentially skewed insights. Another scenario involves changes to a GROUP BY clause. Removing a column from a GROUP BY might seem harmless if there’s no direct dependency on this specific grouping column downstream. However, it can still have a significant impact. Changing the grouping could alter the result set’s structure, potentially causing queries that rely on this structure to fail, or produce unexpected results.
- You have a requirement to trace data lineage across different types of databases in your organisation.
- You have a requirement to trace data across non-database tools and technologies, e.g. ETL, BI, Excel, Java code.
- You need support for SELECT read-only queries (DQL) on top of write operations (DML). SELECT statements often serve as dependencies for analytics, dashboards, and reports. By tracking lineage at the query level, you can assess the downstream impacts of changes. For instance, if a table’s schema changes and you don’t track the data lineage of SELECT statements you will not be able to assess the impact on dashboards, reports and other types of regular analyses using SQL.
- You need to track the lineage of inline views.
- You need to track end to end lineage of SQL queries including subqueries and inline views. FlowHigh SQL Visualiser can track this type of lineage.
- You need to keep track of deleted objects older than 14 days.
- You need an option to add lineage manually.
- You need to export diagrams
You might also like to read:
BigQuery Data Lineage – Latest Guide
Databricks Data Lineage – Latest Guide
Reference Enterprise Data Architecture – Latest Guide
FAQ
How can I track lineage in Snowflake without third-party data lineage tools?
You can access Snowflake lineage in three ways:
- Snowflake provides access through view ACCOUNT_USAGE.ACCESS_HISTORY where mappings between source and target columns of a write operation are stored as a JSON array in column OBJECTS_MODIFIED
- You can use the Snowsight Data Lineage UI to visualise data lineage in a diagram
- You can use APIs to access data lineage programmatically. The following options are available:
Can I visualise the lineage of an SQL query?
Snowflake does not track intra SQL query lineage, e.g. inline views or subqueries. You’ll need an SQL Visualiser such as FlowHigh SQL Visualiser.
I have written a separate post about visualisation of SQL query code.
Can I track lineage for both DML and DQL (SELECT) statements in Snowflake?
Snowflake only tracks the lineage of write operations (DML), not read operations (DQL).
How is lineage data stored or managed in Snowflake?
Lineage data is stored in view ACCOUNT_USAGE.ACCESS_HISTORY as a JSON array. Each write operation (DML) is logged, and the mappings between source and target logged in column OBJECTS_MODIFIED.
When should I use a third party lineage tool?
Here are some of the reasons why you’ll want to rely on an external data lineage solution.
Snowflake’s lineage features show dependencies but lack detail for assessing indirect impacts, such as those caused by changes to filtering or grouping logic, which can alter downstream data structure or the data itself and impact accuracy. Comprehensive lineage tracking should include SELECT statements, subqueries, and inline views to capture both upstream and downstream dependencies and their effects on analytics and reports. Typically, you’ll also want to trace lineage across multiple databases, non-database tools like ETL or BI, manage manual adjustments, and visual exports for complete control.
Trouble with your data
pipeline but not sure why?
Start with a complimentary data pipeline review
Fill in the form and schedule a chat with our experts.
What will you get on the call?
- Helpful advice on the weak spots in your pipeline
- No sales pitches
- No commitments
Thank you for providing your details.
We'll get back to you asap!

Book your FREE
data pipeline review
30 min session
Uli Bethke
Uli has been rocking the data world since 2001. As the Co-founder of Sonra, the data liberation company, he’s on a mission to set data free. Uli doesn’t just talk the talk—he writes the books, leads the communities, and takes the stage as a conference speaker.
Any questions or comments for Uli? Connect with him on LinkedIn.
Follow Uli Bethke: