Parsing SQL queries in MS SQL Server
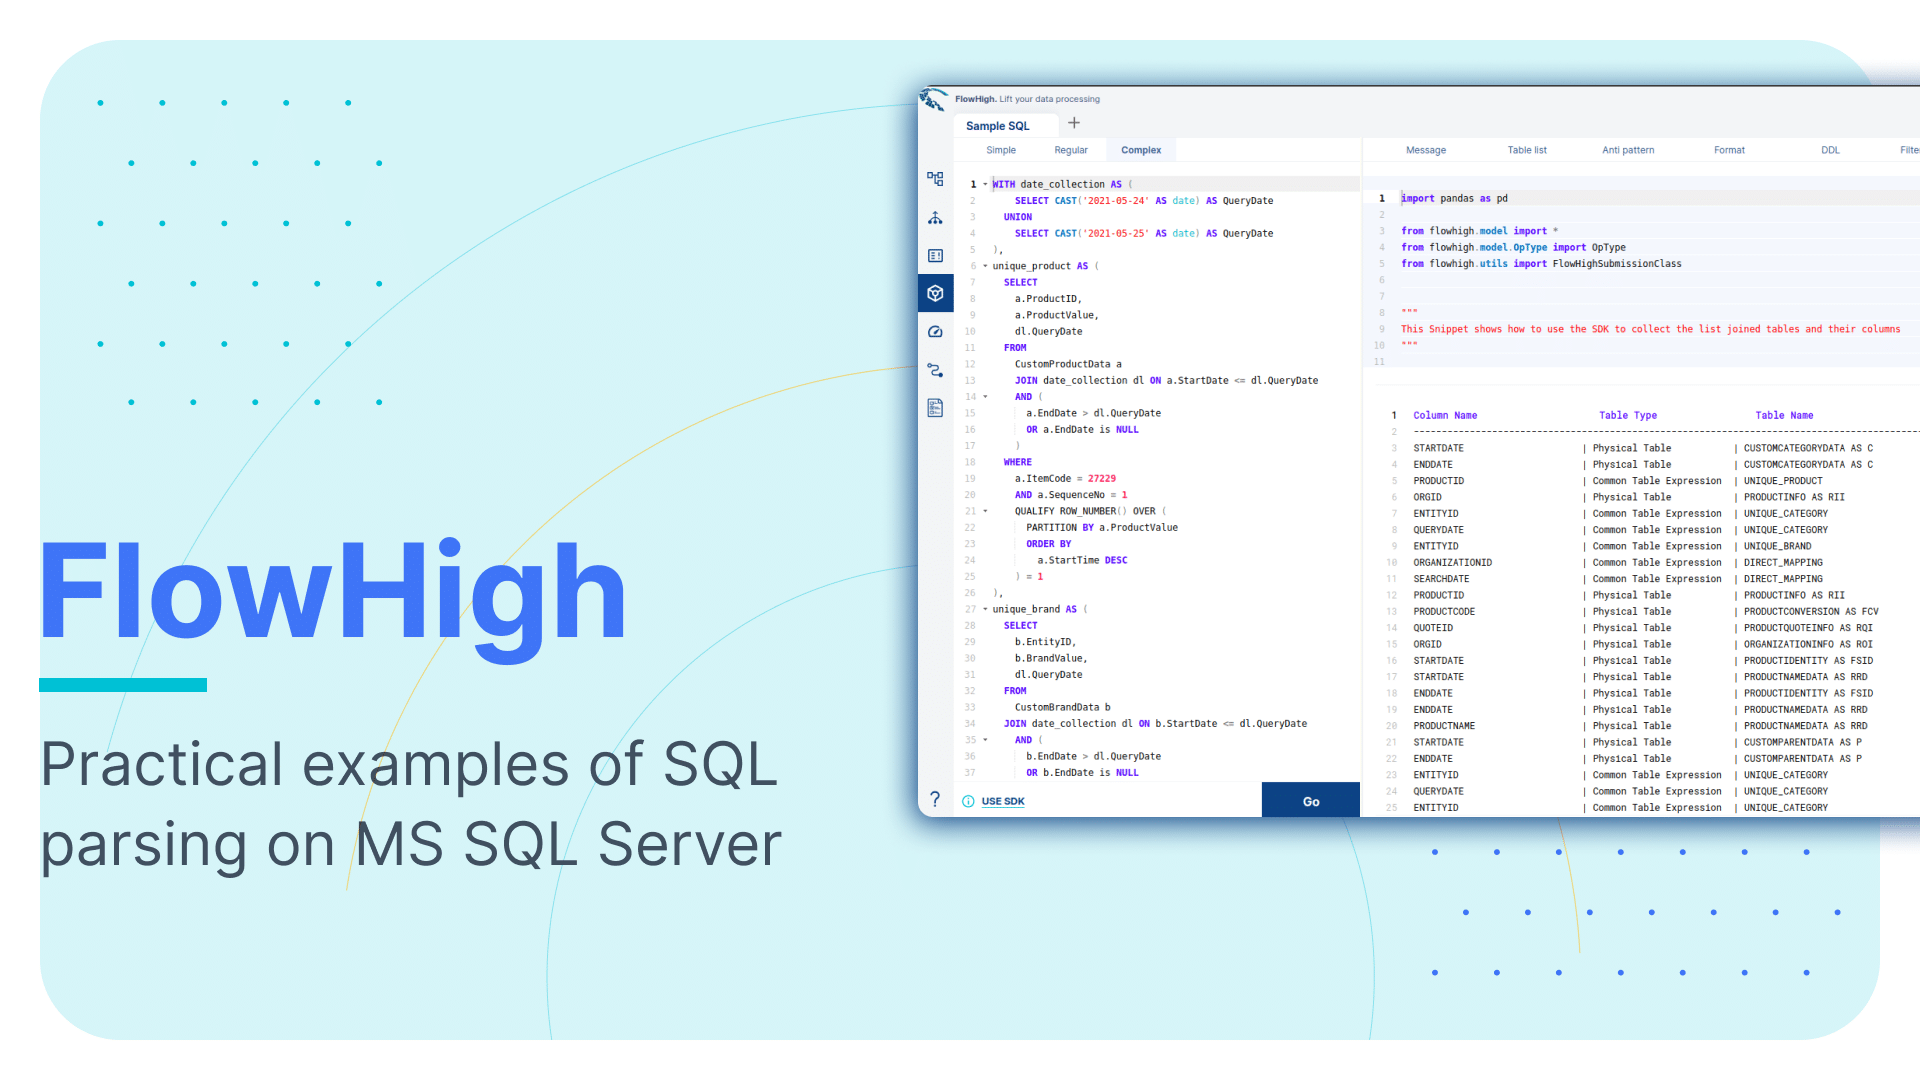
This is the third article in our series on parsing SQL in different database technologies and SQL dialects. We explored SQL parsing on Snowflake and then Oracle in our earlier blog posts. We cover SQL parsing on MS SQL Server in this blog post.
We provide practical examples of interpreting SQL from the SQL Server query history. Additionally, we will present some code that utilizes the FlowHigh SQL parser SDK to programmatically parse MS SQL. The parsing of SQL Server SQL can be automated using the SDK.
In another post on the Sonra blog, I go into great depth on the benefits of using an SQL parser.
One example for a use case would be table and column audit logging. Audit logging refers to the detailed recording of access and operations performed on specific tables and columns in a database including execution of distinct in SQL queries. Such logging can be essential for ensuring security, compliance with regulatory standards, and understanding data access patterns.
Use Flexter to turn XML and JSON into Valuable Insights
- 100% Automation
- 0% Coding
SQL parser for SQL Server
A powerful online SQL parser designed for any SQL dialect, including MS SQL Server, is called FlowHigh. This SaaS platform includes an easy-to-use UI for manual SQL parsing as well as an SDK for managing bulk SQL parsing requirements or automating the operation. We demonstrate FlowHigh’s capabilities by parsing the query history of the MS SQL Server. To programmatically parse the query history, we used the SDK.
Programmatically parsing the MS SQL query history with the FlowHigh SDK
MS SQL Server keeps an extensive log of all SQL statements cached in its plan cache, which can be examined for performance data and query specifics. The dynamic management views of SQL Server can be used to get this data.
sys.dm_exec_query_stats and the associated function sys.dm_exec_sql_text(), is a crucial part of the SQL analysis process. The sys.dm_exec_query_stats view provides information on the execution statistics of cached query plans, including information on the number of executions, CPU usage, total time spent, and more. You can get the precise text of the SQL statement connected to each cached plan by using the sys.dm_exec_sql_text() method in combination with it. This is very helpful for locating and analysing executed SQL statements that are affecting the speed of the SQL Server instance.
These dynamic management items work as useful resources for understanding SQL execution characteristics and patterns in MS SQL Server.
To get the required data from the MS SQL query history, we used the following SQL query:
|
1 2 3 4 5 6 7 8 |
SELECT distinct dest.text AS [QueryText], CONVERT(VARCHAR(50), query_hash, 1) AS query_hash FROM sys.dm_exec_query_stats AS deqs CROSS APPLY sys.dm_exec_sql_text(deqs.sql_handle) AS dest where dest.text like 'SELECT%' |
The Python code provided below was then used to parse all of the questions that were pulled from the query history:
|
1 2 3 4 5 6 7 8 9 10 11 12 13 14 15 16 17 18 19 20 21 22 23 24 25 26 27 28 29 30 31 32 33 34 35 36 37 38 39 40 41 42 43 44 45 46 47 48 49 50 51 52 53 54 55 56 57 58 59 60 61 62 63 64 |
import os import pyodbc import requests import pandas as pd from sqlalchemy import create_engine from json.decoder import JSONDecodeError from flowhigh.utils.converter import FlowHighSubmissionClass # Setting the connection parameters server = os.getenv('MS_SQL_server') database = os.getenv('MS_SQL_database') username = os.getenv('MS_SQL_username') password = os.getenv('MS_SQL_password') # creating a connection to database cnxn = pyodbc.connect( 'DRIVER={SQL Server};SERVER=' + server + ';DATABASE=' + database + ';UID=' + username + ';PWD=' + password) conn = create_engine(f'mssql+pyodbc://{username}:{password}@{server}/{database}?driver=ODBC+Driver+17+for+SQL+Server') cursor = cnxn.cursor() # query to get query history from MS SQL server select_query = ''' SELECT distinct dest.text AS [QueryText], CONVERT(VARCHAR(50), query_hash, 1) AS query_hash FROM sys.dm_exec_query_stats AS deqs CROSS APPLY sys.dm_exec_sql_text(deqs.sql_handle) AS dest where dest.text like 'SELECT%' ''' # executing the query cursor.execute(select_query) rows = cursor.fetchall() # list to store response from FH and error data = [] error_entry = [] # setting table name to load the results fh_table_name = 'fh_response' error_log_table_name = 'fh_error_log' # looping through results for row in rows: try: fh = FlowHighSubmissionClass.from_sql(row.QueryText) data_entry = {'query_hash': row.query_hash, 'JSONData': fh.json_message} query_id = +1 data.append(data_entry) print(row.query_hash) except (requests.exceptions.HTTPError, JSONDecodeError, requests.exceptions.RequestException) as err: print(f"An error occurred during processing of row {err}") entry = {'query_hash': row.query_hash} error_entry.append(entry) # converting list to dataframes data_df = pd.DataFrame(data) error_df = pd.DataFrame(error_entry) # writing the dataframes to respective tables data_df.to_sql(fh_table_name, conn, if_exists='append', index=False) error_df.to_sql(error_log_table_name, conn, if_exists='append', index=False) |
Analysing the output of the FlowHigh SQL parser
An SQL query is ingested by the FlowHigh SQL parser for MS SQL Server, which then returns the processed result either as a JSON or XML message. For instance, the parser produces a full JSON message of the SQL query from sys.dm_exec_query_stats. This output includes information on the filter conditions, fields fetched, aliases used, join conditions, tables and other components of the SQL statement.
Let’s go through an example
|
1 2 3 4 5 6 7 8 9 10 11 |
SELECT p.ProductID ,p.Name AS ProductName ,c.Name AS CategoryName ,sc.Name AS SubcategoryName FROM Production.Product AS p INNER JOIN Production.ProductSubcategory AS sc ON p.ProductSubcategoryID=sc.ProductSubcategoryID INNER JOIN Production.ProductCategory AS c ON sc.ProductCategoryID=c.ProductCategoryID; |
In addition to being thorough, the output XML is also more condensed than JSON. For illustration, the following is an example SELECT statement output in XML:
|
1 2 3 4 5 6 7 8 9 10 11 12 13 14 15 16 17 18 19 20 21 22 23 24 25 26 27 28 29 30 31 32 33 34 35 36 37 38 39 40 41 42 43 44 45 46 47 48 49 50 51 |
<?xml version="1.0" encoding="UTF-8"?> <parSeQL version="1.0" status="OK" ts="2023-08-22T09:17:54.853Z" xmlns:xsi="http://www.w3.org/2001/XMLSchema-instance" xsi:schemaLocation="https://flowhigh.sonra.io/flowhigh_v1.0.xsd"> <statements> <statement pos="0-346"> <ds pos="0-346" type="root" subType="inline"> <out> <attr pos="7-11" dboref="C1"/> <attr pos="26-21" alias="ProductName" dboref="C2"/> <attr pos="55-22" alias="CategoryName" dboref="C3"/> <attr pos="85-26" alias="SubcategoryName" dboref="C4"/> </out> <in> <ds pos="120-23" alias="p" dboref="T1"/> <join type="inner" definedAs="explicit"> <ds pos="160-35" alias="sc" dboref="T2"/> <op pos="204-46" type="EQ"> <attr pos="204-22" dboref="C5"/> <attr pos="227-23" dboref="C6"/> </op> </join> <join type="inner" definedAs="explicit"> <ds pos="266-31" alias="c" dboref="T3"/> <op pos="306-40" type="EQ"> <attr pos="306-20" dboref="C7"/> <attr pos="327-19" dboref="C8"/> </op> </join> </in> </ds> </statement> </statements> <DBOHier> <dbo oid="S1" type="SCHEMA" name="Production"> <dbo oid="T1" type="TABLE" name="Product"> <dbo oid="C1" type="COLUMN" name="ProductID"/> <dbo oid="C2" type="COLUMN" name="Name"/> <dbo oid="C5" type="COLUMN" name="ProductSubcategoryID"/> </dbo> <dbo oid="T2" type="TABLE" name="ProductSubcategory"> <dbo oid="C4" type="COLUMN" name="Name"/> <dbo oid="C6" type="COLUMN" name="ProductSubcategoryID"/> <dbo oid="C7" type="COLUMN" name="ProductCategoryID"/> </dbo> <dbo oid="T3" type="TABLE" name="ProductCategory"> <dbo oid="C3" type="COLUMN" name="Name"/> <dbo oid="C8" type="COLUMN" name="ProductCategoryID"/> </dbo> </dbo> </DBOHier> </parSeQL> |
A complete description of the SQL statement, including the fully qualified table name, any where conditions, and joins used in the query, are provided in the XML from Flowhigh SQL parser. When looking into our sample query, FlowHigh identifies attributes such as ProductID, ProductName, CategoryName, and SubcategoryName sourced from three tables.
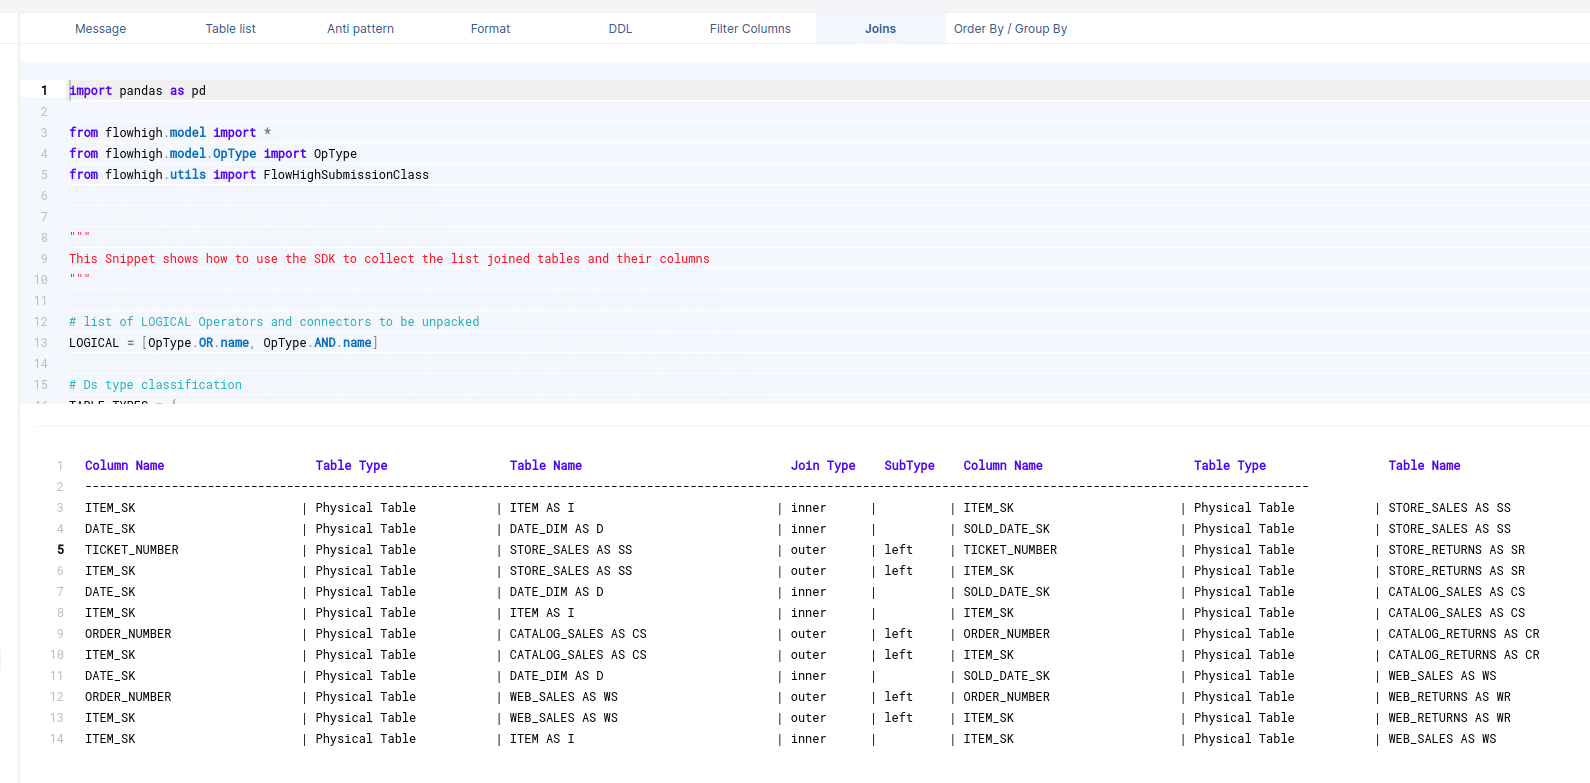
You will also find the two inner joins along with the columns in the join condition.
With the help of FlowHigh’s SQL parser and the corresponding XSD schema, we can analyse, comprehend, and modify SQL statements taken from the query history of MS SQL Server. We gain insights into database relationships and structures by dissecting the complex properties and patterns hidden within the SQL queries through analysis of the parsed data.
The FlowHigh SDK ships with various abstractions to easily identify the following information:
Columns in join conditions
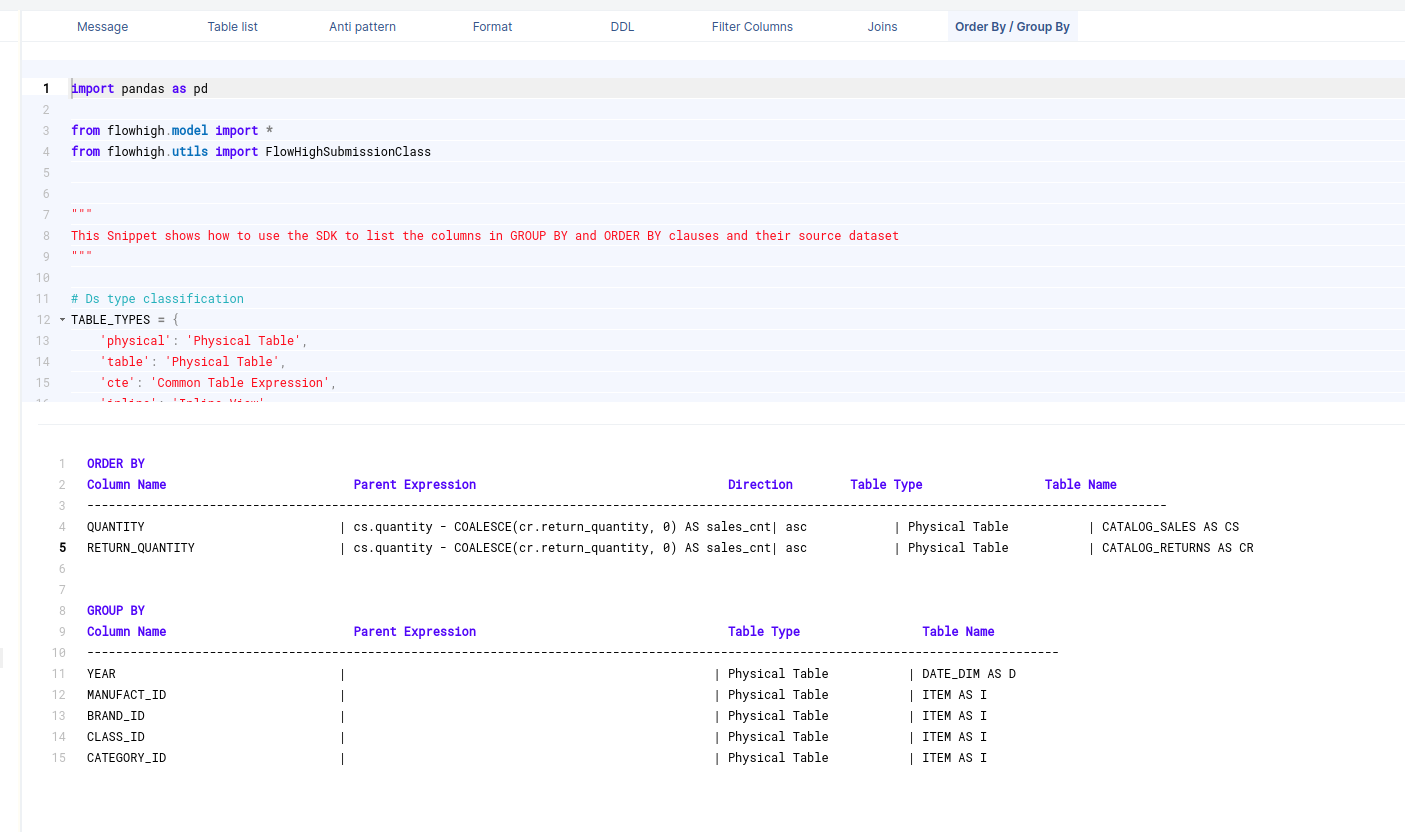
Columns used in GROUP BY / ORDER BY clause
Filter columns
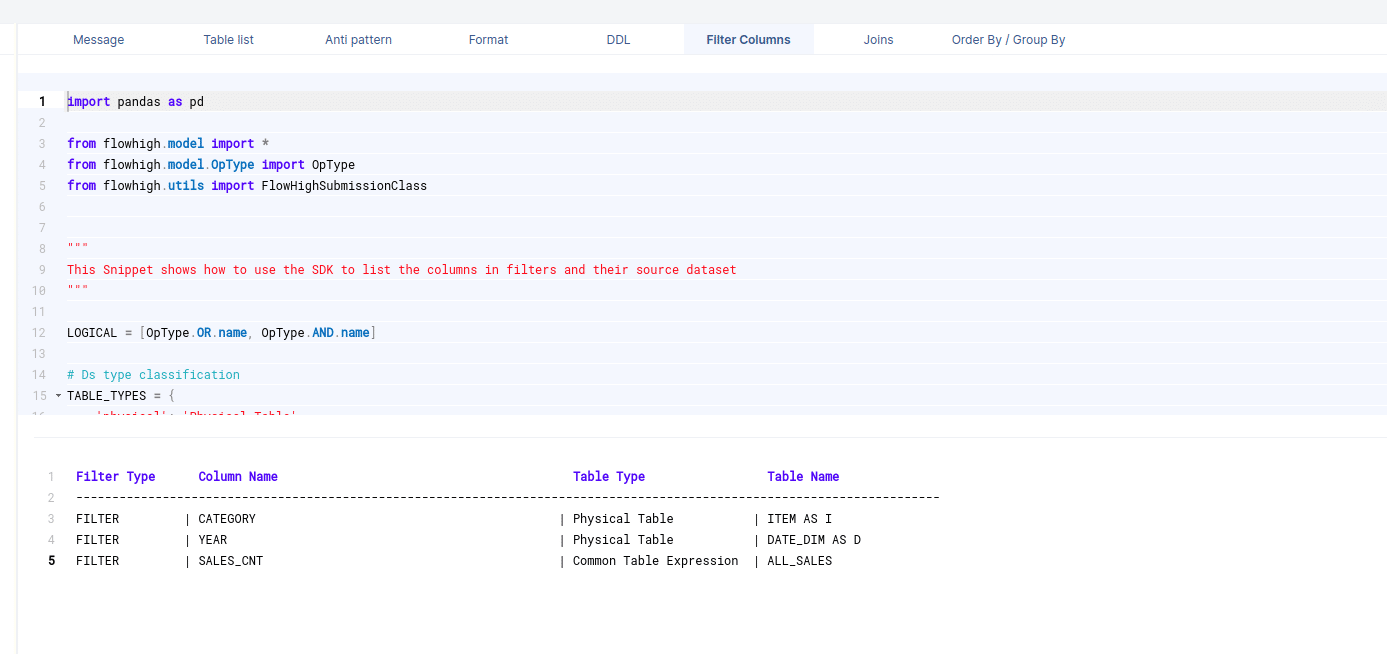
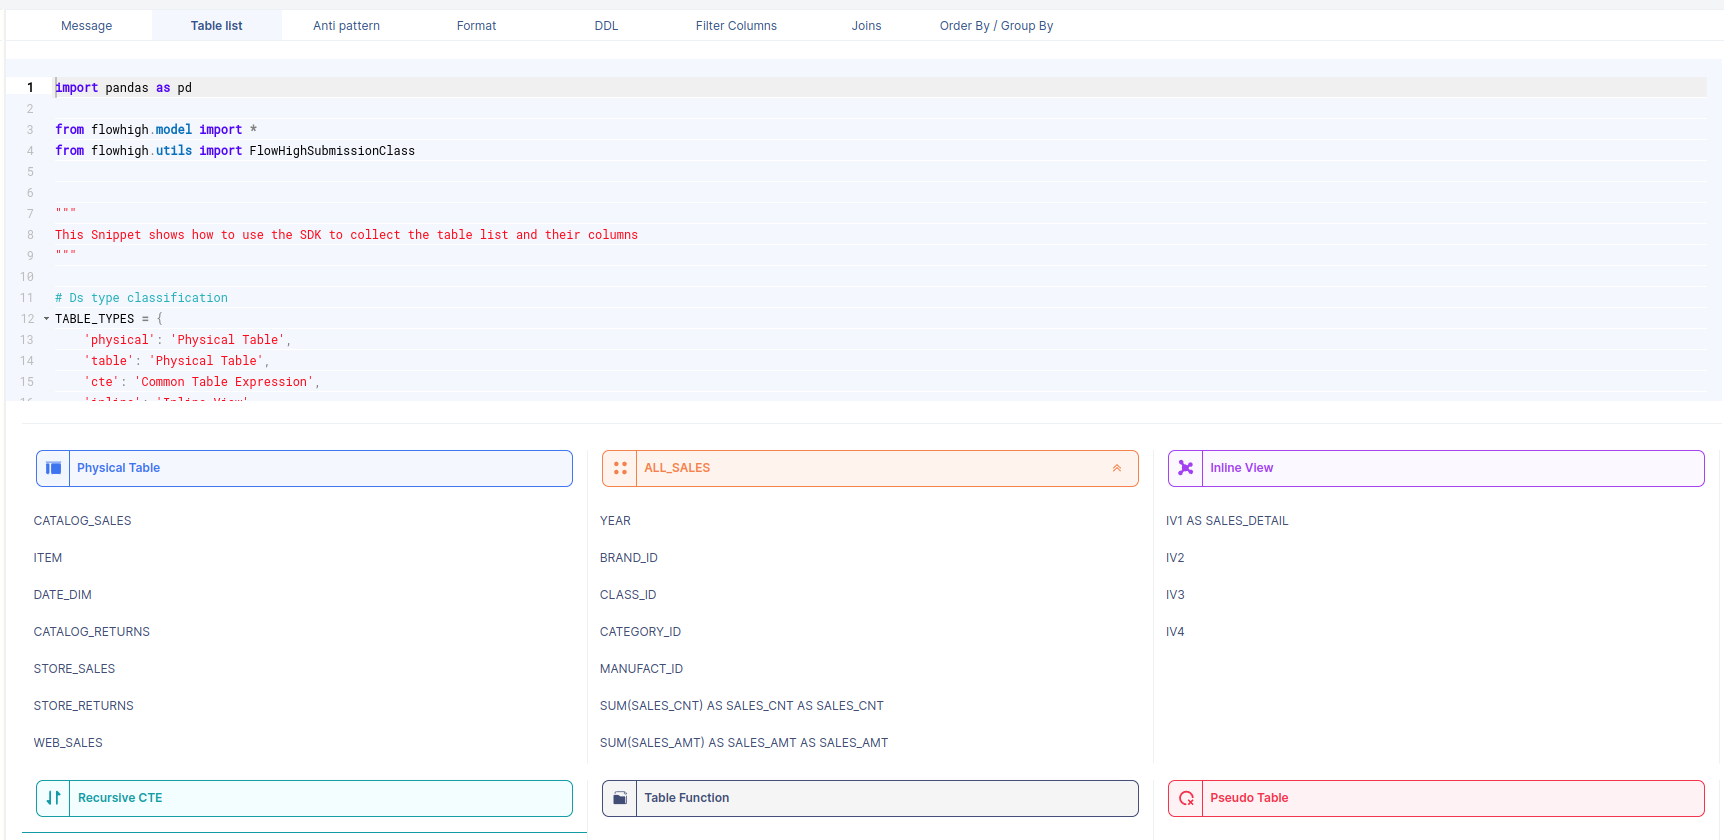
Table types such as persisted tables, inline views, CTEs, views etc.. This also includes columns in the SELECT clause
Do you think we are missing abstractions? Contact us with your suggestions
Gain access to FlowHigh today.


