BigQuery Data Lineage Guide – Features, API, & Limitations

In this post I dive deep into the BigQuery data lineage feature. For those of you who are not familiar with data lineage here is a quick primer.
Data lineage is the process of tracking and visualising the journey of data as it moves through different systems, transformations, and workflows. It shows where data comes from (source), how it changes along the way (transformations), and where it ends up (destination).
It helps you answering questions like:
- Where did this data originate?
- What transformations or calculations were applied to it?
- Which reports, dashboards, or systems are using this data?
- What happens if I make a change to my data pipeline and who will be impacted by this change.
In this blog post I will first give you an intro to BigQuery Lineage and how it relates to the GCP Dataplex catalog. I will then get hands on and show you how to set up and enable lineage in BigQuery. Next I will create a data pipeline and I explore the various features of BigQuery lineage using this pipeline as an example. I will then show you how you can access the BigQuery API programmatically using the REST API. I have prepared various code examples in python that will show you how to work with the most common endpoints and the dependencies between them. I finish out the post with some thoughts on the BigQuery lineage limitations and explore scenarios when a third party data lineage tool is a better fit.
If you are in a rush I have compiled the most important points here:
BigQuery lineage is a part of the Dataplex data catalog. Apart from BigQuery, Dataplex also supports lineage for other GCP tools such as CloudComposer.
You can access lineage through a visual diagram or programmatically through an API.
BigQuery doesn’t support column-level lineage yet, which is a big downside compared to Snowflake and Databricks. That said, column lineage is in private preview as of January 2026.
BigQuery lineage does not support impact or root cause analysis.
One thing that really annoys users is how lineage doesn’t show up in real time and can take up to 24 hours to appear. This causes a lot of confusion, and you’ll see plenty of questions about it on forums like Stack Overflow and Reddit.
The visual lineage graph is super clean and easy to use. SQL processes are shown as their own nodes, which makes more sense compared to Databricks, where they’re hidden as edges.
The REST API is pretty straightforward to use, but unlike Databricks or Snowflake, there aren’t any system tables or views to access lineage through SQL.BigQuery does not visualise individual SQL queries. You can use FlowHigh SQL visualiser to visualise SQL code.
Ok. Let’s dive into the world of BigQuery data lineage
Use Flexter to turn XML and JSON into Valuable Insights
- 100% Automation
- 0% Coding
BiqQuery Lineage and Dataplex
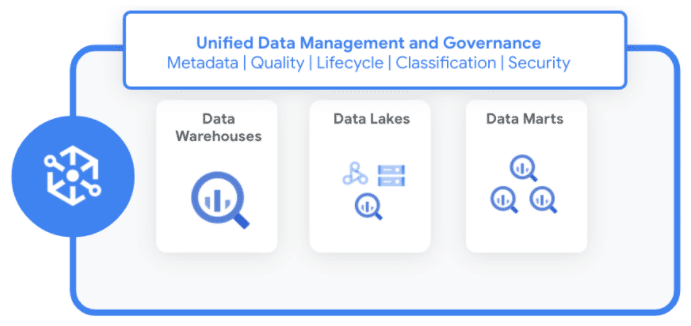
BigQuery data lineage is a feature of the Google Cloud’s Dataplex data catalog.
Google Cloud’s Dataplex offers a centralized platform to manage, monitor, and govern data across various data architectures including data lakes, data warehouses, data mesh, and data marts.
Some key features of Dataplex:
- Data Organization and Lifecycle Management: Dataplex introduces constructs such as lakes, zones, and assets to logically organize data in alignment with business domains or units. This abstraction enables policy setting for data access, security, and lifecycle management without necessitating data movement or duplication.
- Data discovery and Catalog: Dataplex automates data discovery, classification, and metadata enrichment of structured, semi-structured, and unstructured data, stored in Google Cloud and beyond, with built-in data intelligence.
- Centralized security and governance: Dataplex enables central policy management, monitoring, and auditing for data authorization and classification, across data silos.
- Built-in Profiling, Data quality and Lineage: Dataplex automates data quality across distributed data and enables access to data and automatically collects data lineage for BigQuery and other GCP products and services. This is the area we will cover in this blog post focusing on BigQuery.
Besides BigQuery, the Dataplex catalog also offers lineage for these other systems and services on Google Cloud:
- Cloud Data Fusion: A fully managed, cloud-native data integration service that allows users to build, manage, and monitor data pipelines with a visual, drag-and-drop interface.
- Cloud Composer: A managed workflow orchestration service based on Apache Airflow, enabling users to schedule and manage data pipelines.
- Dataproc: A fully managed service for running Apache Spark, Apache Hadoop, and other open-source data processing frameworks.
- Vertex AI: A machine learning platform on Google Cloud that supports building, deploying, and scaling AI models with tools for data preparation, model training, and MLOps.
If you want to find out more check this series of articles about Dataplex on Medium by a Google employee.
What is BiqQuery Lineage?
Now we know that BigQuery lineage is a feature of Dataplex. But what exactly is it and how is it useful?
BigQuery lineage refers to the ability to track the flow of data through various stages of processing, transformation, and usage. It gives you a detailed map of where data comes from, how it is transformed, and where users consume it. This is important for understanding dependencies in data pipelines.
Let me give you an analogy. Think of BigQuery lineage as tracking the process of baking bread in a bakery, where raw ingredients (data sources) go through various steps (data transformations) before becoming a finished product (reports or analytics).
- Raw Ingredients (Data Sources): Flour, water, yeast, and salt represent raw data. These are sourced from different suppliers (external systems, CSV files, or APIs).
- Mixing and Kneading (Data Transformation): The ingredients are combined and processed, similar to how raw data is cleaned, enriched, or joined with other datasets through SQL queries or ETL tools. Each step of transformation builds on the previous one—mixing ingredients transforms them into dough.
- Distribution (Consumption): The packaged bread is sent to stores or directly to customers, just as processed data is sent to reporting tools, dashboards, or machine learning models and accessed by end users.
Why use BigQuery Lineage
There are a couple of scenarios when data lineage in BigQuery is useful. I have listed a few of them.
- Debugging and Troubleshooting: When a dashboard shows incorrect results, lineage helps pinpoint the source of the issue. For example, you can trace back to see if the problem lies in a specific dataset or the code for the transformation logic.
- Impact Analysis: Before modifying a dataset, table, or SQL statement, lineage reveals all downstream dependencies. This prevents unintended disruptions to dashboards, reports, or machine learning workflows that rely on the data.
- Data Governance and Compliance: In industries with strict compliance requirements (e.g., GDPR or HIPAA), lineage helps demonstrate how PII data flows through the system, who has access to it, and how it is transformed. Data lineage in this scenario brings light to the black box.
- Optimising Data Pipelines: By visualising the entire data flow, you can identify issues or anomalies in your pipelines.
Accessing data lineage in BigQuery
You can access data lineage using:
- Data Lineage API as JSON
- Lineage visualization graphs from inside Dataplex.
- Lineage visualization graphs from BigQuery UI directly
- Vertex AI
BigQuery lineage versus Snowflake and Databricks lineage
Unlike Snowflake or Databricks, which provide lineage insights through system tables that explicitly track dependencies between tables, BigQuery.
BigQuery also does not provide data lineage at the column level.
Bring your own data lineage to BigQuery
The Data Lineage API in Dataplex allows you to manually record lineage information for data sources that are not natively supported by Dataplex.
“Bring your own data lineage” means manually integrating and importing lineage metadata that you have independently captured or generated, rather than relying solely on the Dataplex’s native lineage tracking capabilities. This approach allows you to combine lineage information from diverse sources, such as custom scripts, other databases, third-party tools, manual documentation, or logs, into a unified platform.
You can use the DataLineage API to record externally curated data lineage.
OpenLineage
OpenLineage is an open-source framework designed to collect, track, and manage data lineage across various data tools and pipelines. It provides a unified framework for capturing metadata about data flows and transformations,
You can directly import lineage recorded in OpenLineage to Dataplex. This is a less manual effort than using the data lineage API.
Key Lineage Components: Processes, Runs, and Events
When working with data lineage in BigQuery you need to understand some key concepts
Process
This concept is easy to understand. It is a data transformation process such as an SQL INSERT statement. For a full list of supported Processes check the documentation/
Here is an example of a Process
|
1 2 3 4 5 6 7 8 9 10 11 |
INSERT INTO `datalineagesql.Car_Data.price_analysis` SELECT vin, make, model, COALESCE(sellingprice, 0) AS sellingprice, COALESCE(mmr, 0) AS mmr, (COALESCE(sellingprice, 0) - COALESCE(mmr, 0)) AS price_difference, `datalineagesql.Car_Data.calculate_market_position`(COALESCE(sellingprice, 0), COALESCE(mmr, 0)) AS market_position FROM `datalineagesql.Car_Data.Car_dataset`; |
Run
This concept is also straightforward. It is the execution of a Process. In other words it is an instance of a Process, Data lineage is only created when a Process is executed and moves data from sources to targets. Unless a Process is run it does not create data lineage Events.
A Run does not have a visual representation on the lineage diagram but you can access the Run details through the UI.
Event
A data lineage Event is created when a Process is executed in a Run. Events are represented as edges on the lineage diagram that define the dependencies between the source and target tables.
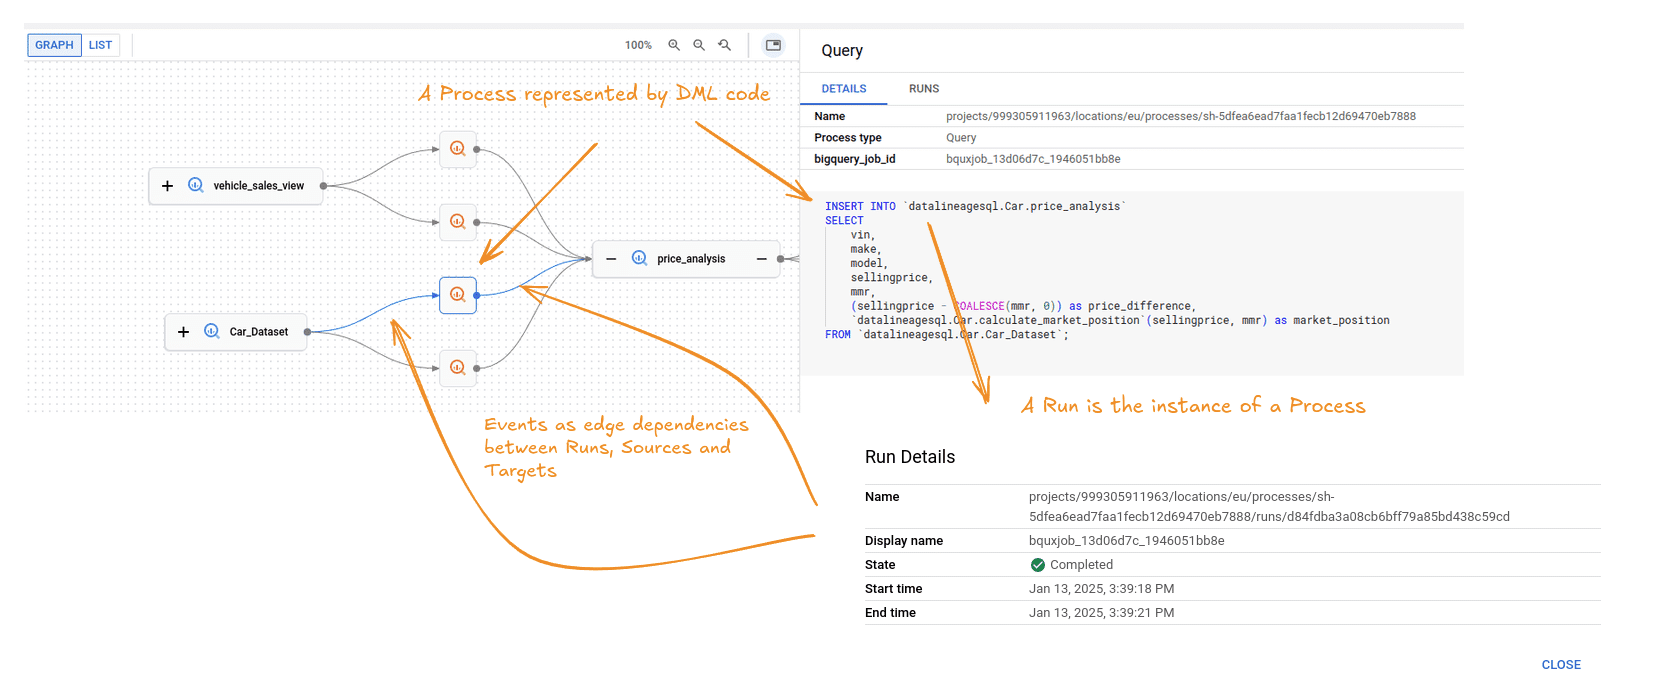
Sources and targets
These are the data sets such as tables that are recorded as Events when an SQL Process such as an INSERT statement is executed as a Run.
Setting up BigQuery lineage
Setup and lineage permissions
Before you can use BigQuery lineage you need to go through the following steps:
- You need to make sure that you billing is enabled on your GCP project
- You need to enable the Data Catalog, BigQuery, and data lineage APIs.
- You need to enable the following roles
- Data Catalog viewer (roles/datacatalog.viewer) on the Data Catalog resource project
- Data lineage viewer (roles/datalineage.viewer) on the project where you use BigQuery
- BigQuery data viewer (roles/bigquery.dataViewer) on the project where you use BigQuery
Now we are ready. Let’s build a data pipeline and then visualise it in BigQuery,
Creating a sample data pipeline
In this section I build a data pipeline from scratch. If you are not interested in the technical details of building a data pipeline you can skip to the next section where I browse the visual diagram and the lineage of the data pipeline.
I used the following data set as the source for our pipeline car_prices.csv
Set up project and data set
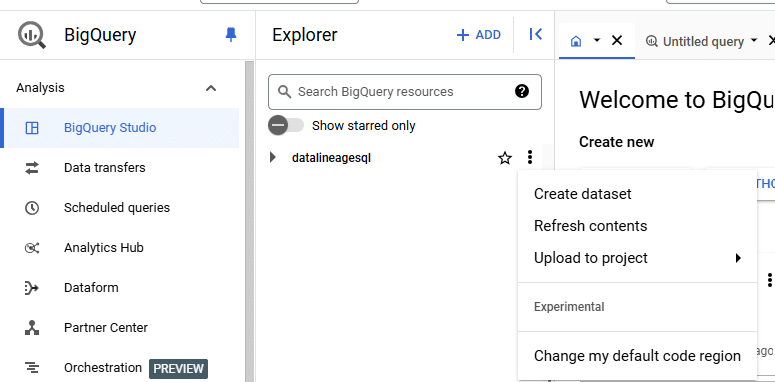
Step 1: Create a new Project
- In the Google Cloud Console, click on the project drop-down menu at the top of the screen and Click on “New Project.”
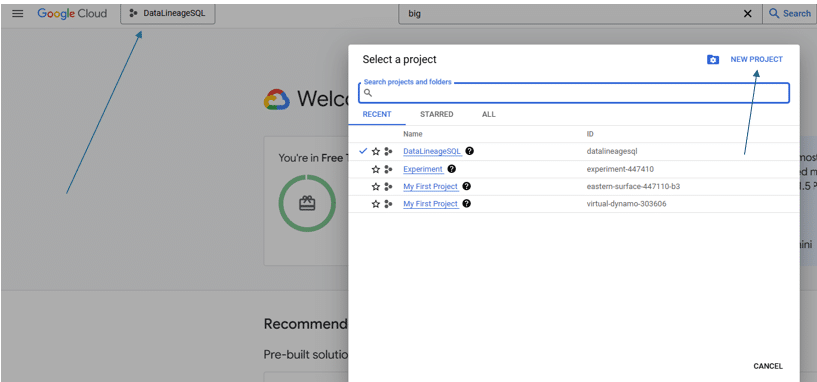
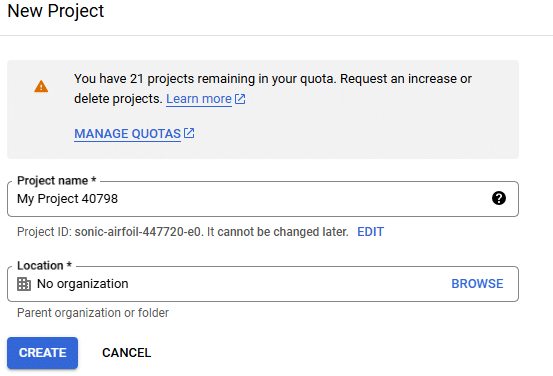
Step 2: Set Up Your Project
- Enter a project name and Click “Create” to set up your new project.
Step 3: Navigate to BigQuery
- Click on your project name in the Cloud Console, navigate to “BigQuery,” and then click on “Create Dataset.
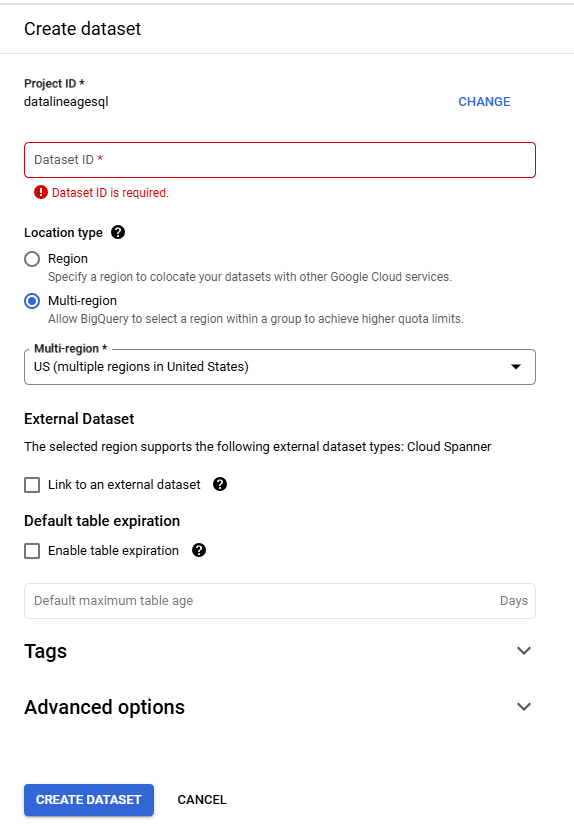
Step 4: Fill in Dataset Details
- Fill in your dataset name (Data set ID), choose a location for your data, and click “Create dataset.”
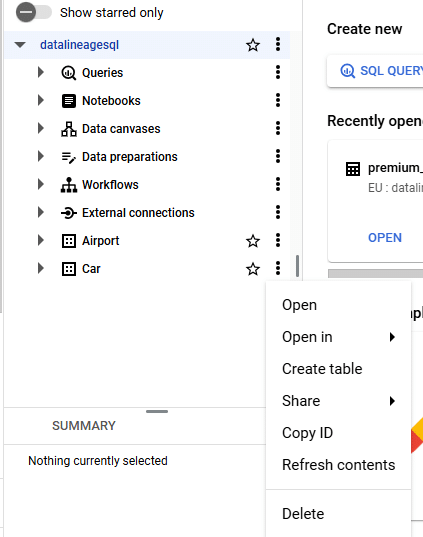
Step 5: Create a Table
- To load data into your dataset, click on your dataset name and then click on “Create Table.”
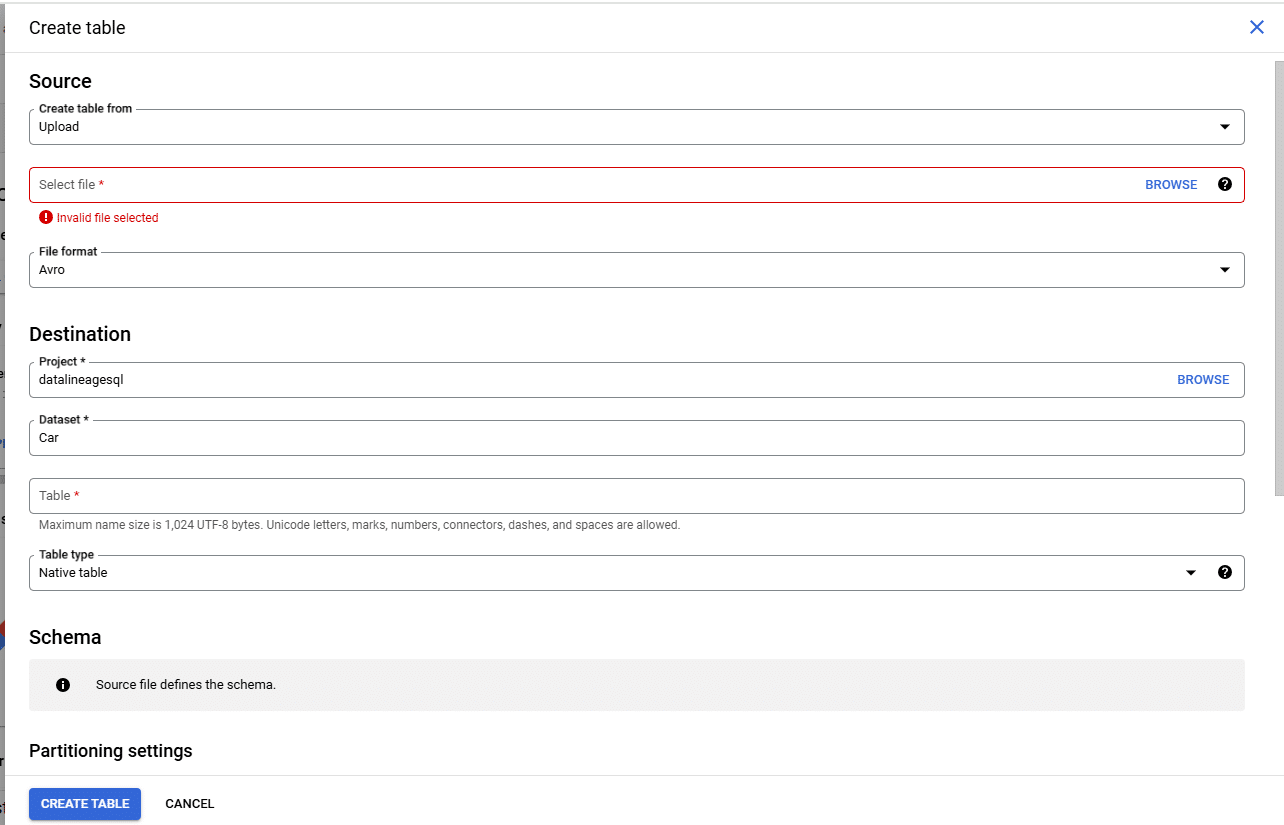
Step 6: Choose Data Source
- Choose the source from which you’d like to load data (e.g., upload from local files or connect to other data sources).
SQL Pipeline
Next I run the code to create the data sets and flows in our pipeline.
Create Vehicle Info Table
|
1 2 3 4 5 6 7 8 9 10 |
CREATE OR REPLACE TABLE `datalineagesql.Car_Data.vehicle_info` AS SELECT DISTINCT vin, year, make, model, trim, body, transmission FROM `datalineagesql.Car_Data.Car_dataset` |
Create Sales Info Table
|
1 2 3 4 5 6 7 8 9 |
CREATE OR REPLACE TABLE `datalineagesql.Car_Data.sales_info` AS SELECT DISTINCT vin, saledate, seller, mmr, sellingprice, state FROM `datalineagesql.Car_Data.Car_dataset`; |
Create Vehicle Condition Table
|
1 2 3 4 5 6 |
CREATE OR REPLACE TABLE `datalineagesql.Car_Data.vehicle_condition` AS SELECT DISTINCT vin, condition, odometer FROM `datalineagesql.Car_Data.Car_dataset`; |
Create premium_vehiclesTable
|
1 2 3 4 5 6 7 8 9 10 11 |
CREATE OR REPLACE TABLE `datalineagesql.Car_Data.premium_vehicles` ( vin STRING, year STRING, make STRING, model STRING, trim STRING, condition INT64, odometer INT64, sellingprice INT64, mmr INT64 ); |
Create vehicles_below_market View
|
1 2 3 4 5 6 7 8 9 10 11 12 13 14 15 |
CREATE OR REPLACE VIEW `datalineagesql.Car_Data.vehicles_below_market` AS SELECT p.vin, p.year, p.make, p.model, p.trim, p.condition, p.odometer, p.sellingprice, p.mmr FROM `datalineagesql.Car_Data.premium_vehicles` AS p WHERE p.sellingprice < COALESCE(p.mmr, 0); |
Create Price Analysis Table
|
1 2 3 4 5 6 7 8 9 |
CREATE OR REPLACE TABLE `datalineagesql.Car_Data.price_analysis` ( vin STRING, make STRING, model STRING, sellingprice INT64, mmr INT64, price_difference INT64, market_position STRING ); |
Create Market Analysis View
|
1 2 3 4 5 6 7 8 9 10 11 12 |
CREATE OR REPLACE VIEW `datalineagesql.Car_Data.market_analysis_view` AS SELECT p.make, p.model, c.condition, AVG(p.sellingprice) as avg_selling_price, AVG(p.price_difference) as avg_price_difference, COUNT(*) as total_sales FROM `datalineagesql.Car_Data.price_analysis` p JOIN `datalineagesql.Car_Data.vehicle_condition` c ON p.vin = c.vin GROUP BY p.make, p.model, c.condition; |
Create premium_analytics Table
|
1 2 3 4 5 6 7 8 9 10 11 12 13 14 15 16 17 18 19 |
CREATE TABLE `datalineagesql.Car_Data.premium_analytics` AS SELECT pv.vin, pv.year, pv.make, pv.model, pv.trim, pv.condition, pv.odometer, pv.sellingprice, pv.mmr, (pv.sellingprice - pv.mmr) as price_premium, CASE WHEN pv.odometer < 30000 THEN 'Low' WHEN pv.odometer < 60000 THEN 'Medium' ELSE 'High' END as mileage_category, CURRENT_TIMESTAMP() as analysis_timestamp FROM `datalineagesql.Car_Data.premium_vehicles` pv; |
Update Vehicle Info Table for Premium Vehicles
|
1 2 3 4 5 6 7 8 |
UPDATE `datalineagesql.Car_Data.vehicle_info` v SET v.trim = 'Premium' WHERE v.vin IN ( SELECT vin FROM `datalineagesql.Car_Data.price_analysis` WHERE market_position = 'Above Market' AND price_difference > 5000 ); |
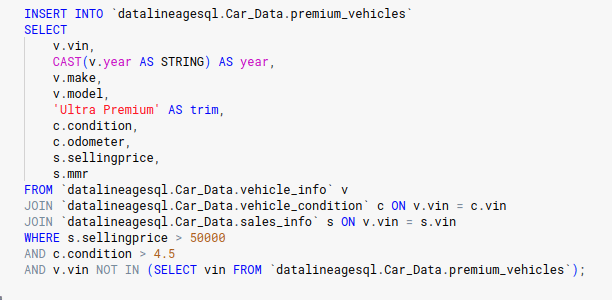
Insert into Premium Vehicles Table
|
1 2 3 4 5 6 7 8 9 10 11 12 13 14 15 16 17 |
INSERT INTO `datalineagesql.Car_Data.premium_vehicles` SELECT v.vin, CAST(v.year AS STRING) AS year, v.make, v.model, 'Ultra Premium' AS trim, c.condition, c.odometer, s.sellingprice, s.mmr FROM `datalineagesql.Car_Data.vehicle_info` v JOIN `datalineagesql.Car_Data.vehicle_condition` c ON v.vin = c.vin JOIN `datalineagesql.Car_Data.sales_info` s ON v.vin = s.vin WHERE s.sellingprice > 50000 AND c.condition > 4.5 AND v.vin NOT IN (SELECT vin FROM `datalineagesql.Car_Data.premium_vehicles`); |
Merge Data into Vehicle Info Table
|
1 2 3 4 5 6 7 8 9 10 11 12 13 14 15 16 17 18 19 20 21 22 |
MERGE INTO `datalineagesql.Car_Data.vehicle_info` AS target USING ( SELECT * FROM ( SELECT vin, year, make, model, trim, body, transmission, ROW_NUMBER() OVER (PARTITION BY vin ORDER BY year DESC) AS row_num FROM `datalineagesql.Car_Data.Car_dataset` ) AS deduplicated_source WHERE row_num = 1 ) AS source ON target.vin = source.vin WHEN MATCHED THEN UPDATE SET target.year = source.year, target.make = source.make, target.model = source.model, target.trim = source.trim, target.body = source.body, target.transmission = source.transmission WHEN NOT MATCHED THEN INSERT (vin, year, make, model, trim, body, transmission) VALUES (source.vin, source.year, source.make, source.model, source.trim, source.body, source.transmission); |
Delete Records from Premium Vehicles
|
1 2 3 |
DELETE FROM `datalineagesql.Car_Data.premium_vehicles` WHERE condition < 4.0 OR sellingprice < 50000; |
Update Premium Vehicles
|
1 2 3 4 5 6 7 8 9 |
UPDATE `datalineagesql.Car_Data.premium_vehicles` SET trim = 'Ultra Premium Elite' WHERE vin IN ( SELECT vin FROM `datalineagesql.Car_Data.premium_analytics` WHERE price_premium > 10000 AND mileage_category = 'Low' AND condition > 4.7 ); |
Insert Values Into sales info
|
1 2 |
INSERT INTO `datalineagesql.Car_Data.sales_info` (vin, saledate, seller, mmr, sellingprice, state) VALUES ('1hgcm82633a123456', 'Thu Dec 18 2014 09:45:00 GMT-0800 (PST)', 'John Doe', 15000, 14000, 'CA'); |
Create a Function to Calculate Market Position
|
1 2 3 4 5 6 7 8 9 |
CREATE OR REPLACE FUNCTION `datalineagesql.Car_Data.calculate_market_position`(sellingprice FLOAT64, mmr FLOAT64) RETURNS STRING AS ( CASE WHEN sellingprice > mmr THEN 'Above Market' WHEN sellingprice < mmr THEN 'Below Market' ELSE 'At Market' END ); |
Insert Data into Price Analysis Using the Function
|
1 2 3 4 5 6 7 8 9 10 11 |
INSERT INTO `datalineagesql.Car_Data.price_analysis` SELECT vin, make, model, COALESCE(sellingprice, 0) AS sellingprice, COALESCE(mmr, 0) AS mmr, (COALESCE(sellingprice, 0) - COALESCE(mmr, 0)) AS price_difference, `datalineagesql.Car_Data.calculate_market_position`(COALESCE(sellingprice, 0), COALESCE(mmr, 0)) AS market_position FROM `datalineagesql.Car_Data.Car_dataset`; |
Create a Materialized View for Premium Car Sales Summary
|
1 2 3 4 5 6 7 8 9 10 |
CREATE OR REPLACE MATERIALIZED VIEW `datalineagesql.Car_Data.Premium_car_sales_summary_mv` AS SELECT make, model, COUNT(vin) AS total_vehicles_sold, AVG(sellingprice) AS avg_selling_price, AVG(mmr) AS avg_mmr, AVG(sellingprice - mmr) AS avg_price_difference FROM `datalineagesql.Car_Data.premium_vehicles` GROUP BY make, model; |
That’s it.
In the next section I will browse the lineage graph of the pipeline.
Accessing BigQuery data lineage
Accessing BigQuery Lineage From Dataplex
You can access BigQuery lineage from inside Dataplex.
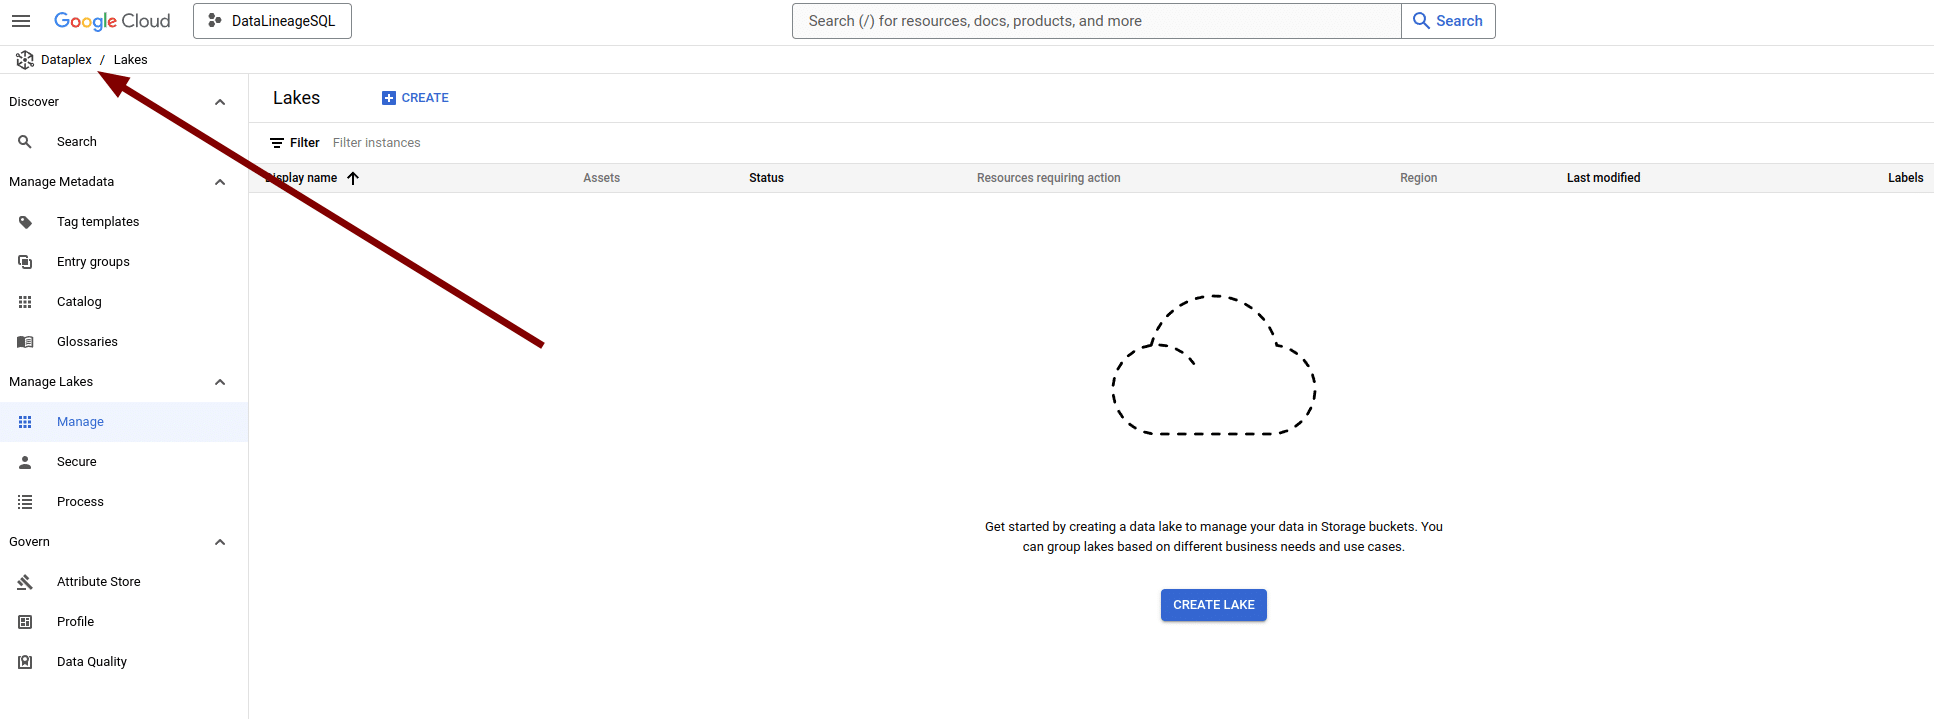
Use the search box at the top to search for a table in BigQuery to get lineage and dependencies
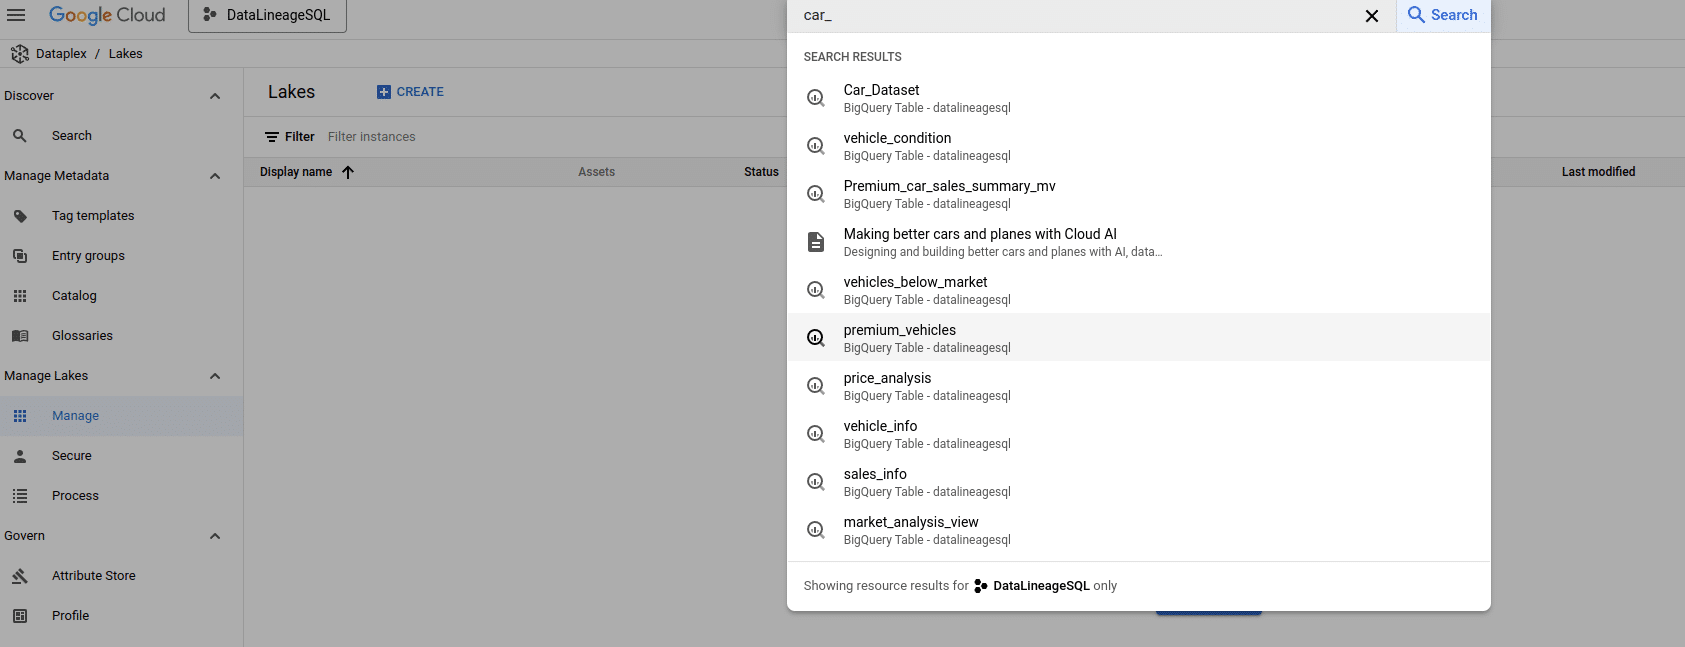
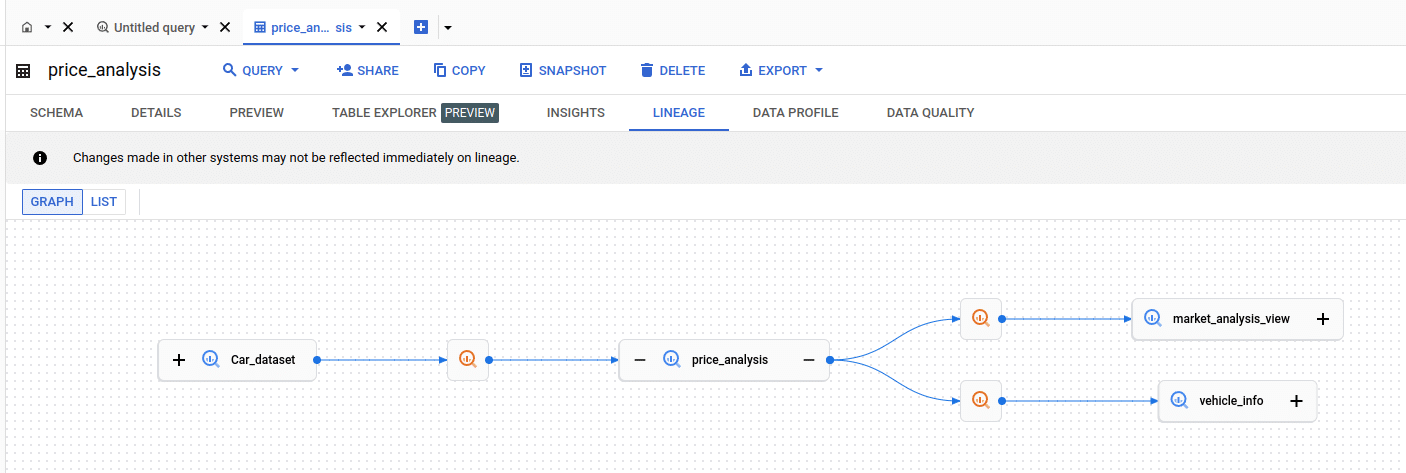
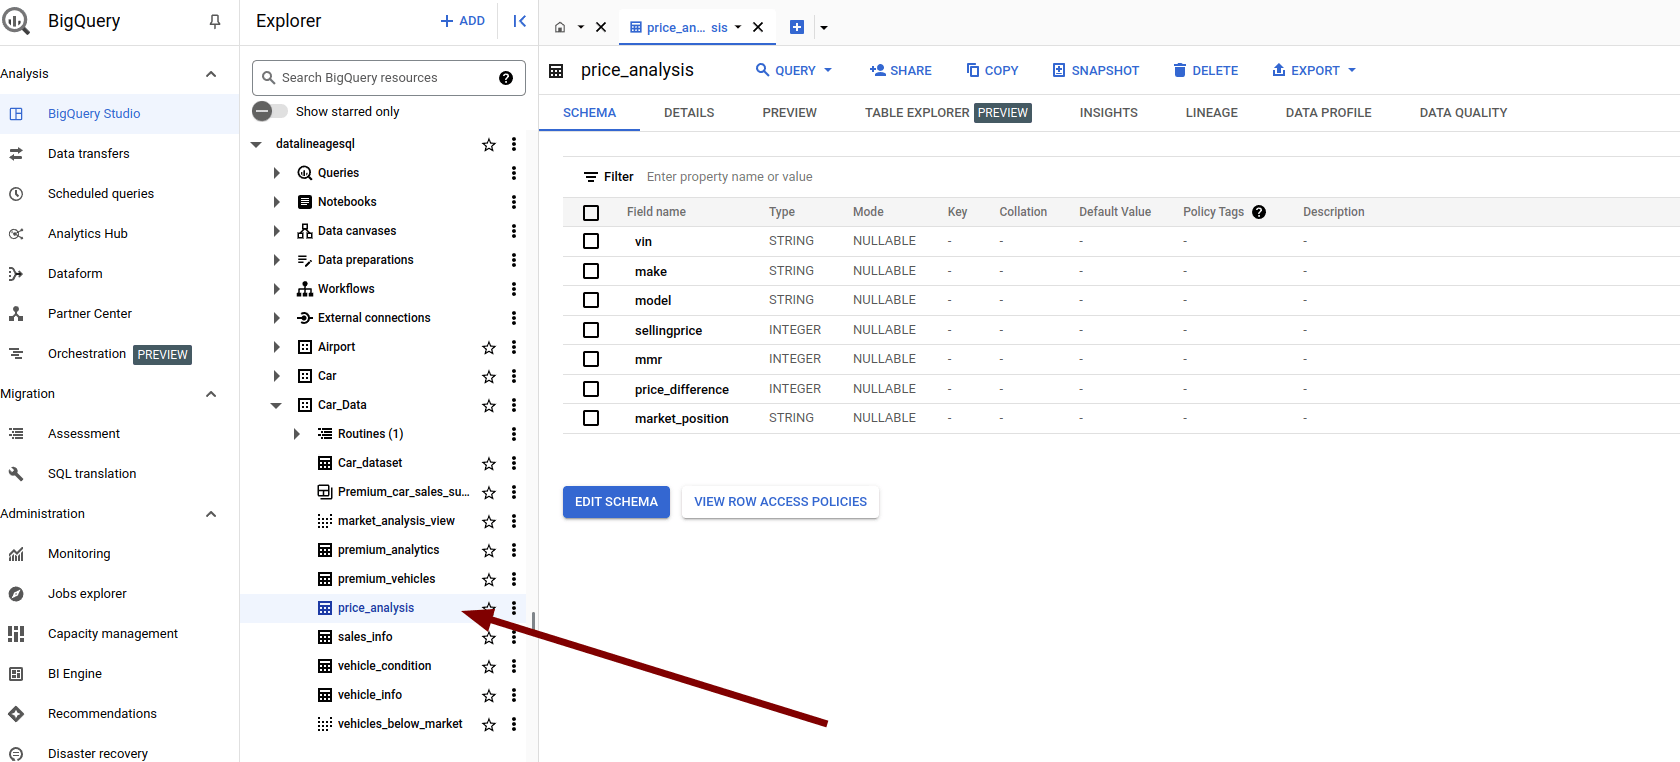
This will bring you to the home page of table price_analysis and you can then access the lineage information for this table
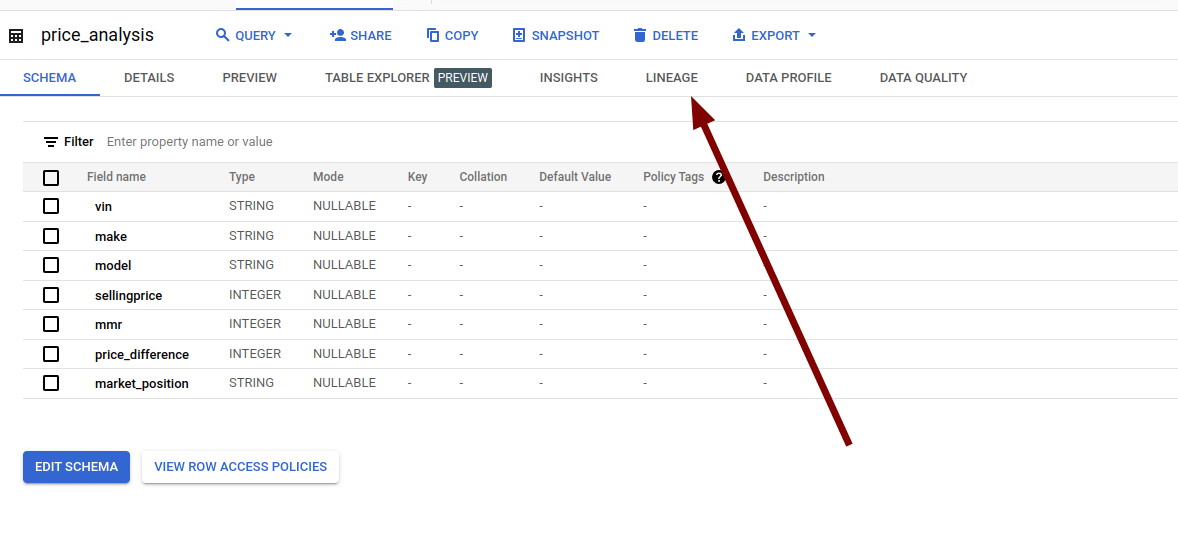
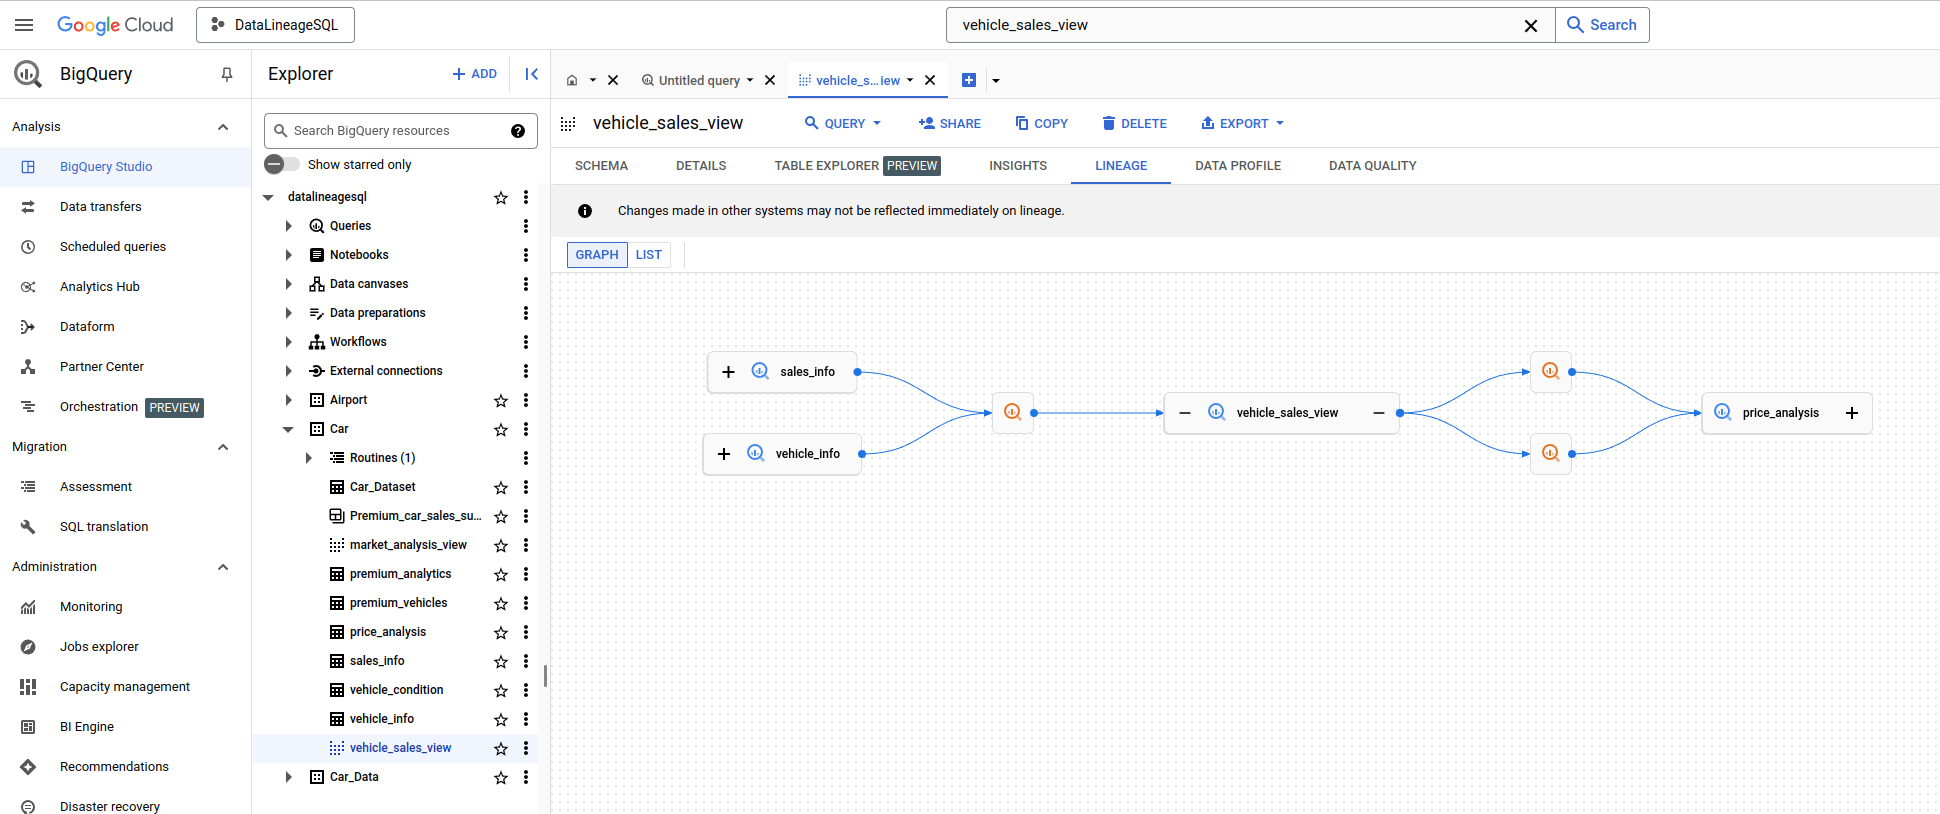
Here is the lineage graph
Accessing BigQuery Lineage directly
Alternatively you can browse to the same table’s page in BigQuery explorer and access the lineage graph from there
Visualising BigQuery Data Lineage
Graph mode
Let’s have a closer look at what features the visual lineage graph gives us.
I start with the basics first.
When you select a table to view its lineage, the diagram displays its direct neighbours. The selected table, referred to as the anchor node, is shown along with its immediate parent and child nodes. These immediate dependencies are the nodes that are just one step away from the anchor node.
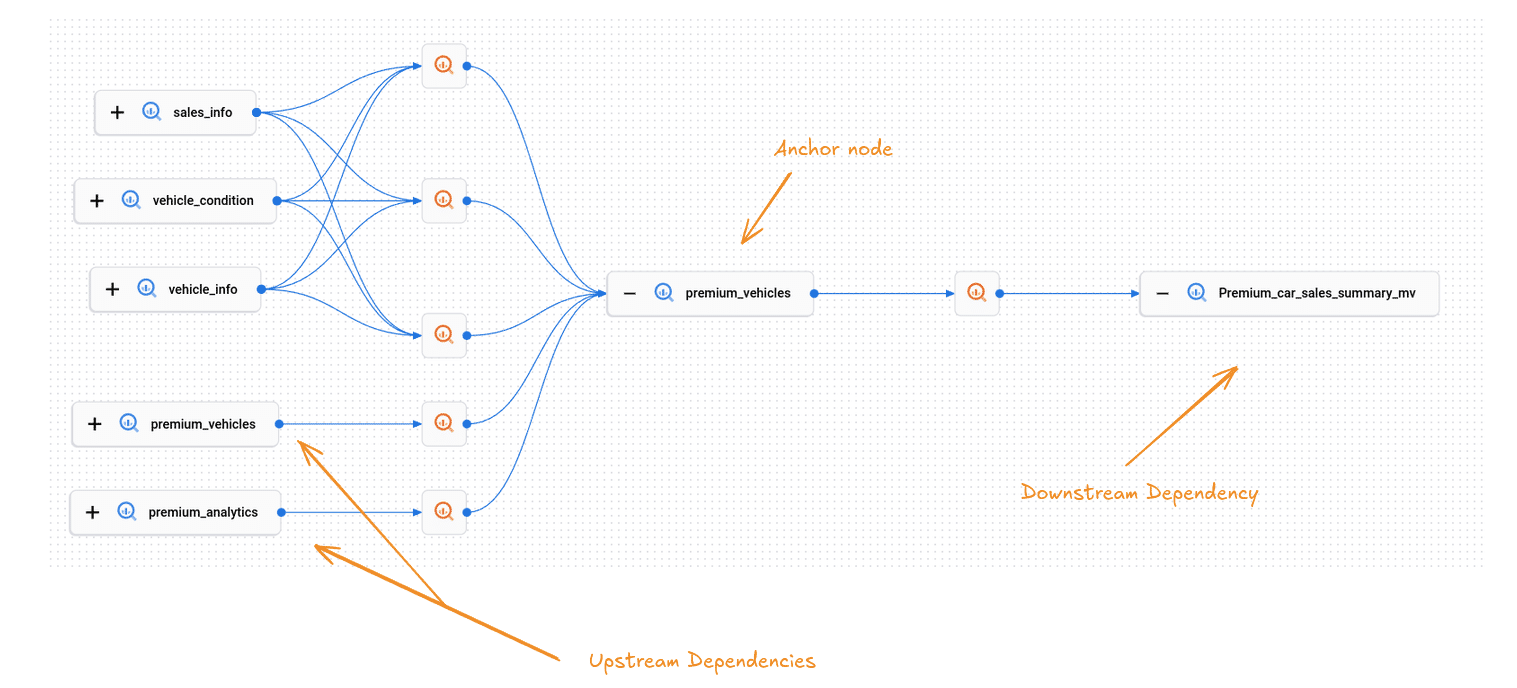
In this figure we have a table premium_vehicles.
This is the anchor node. The lineage graph shows the upstream and downstream tables that depend on the anchor node table.
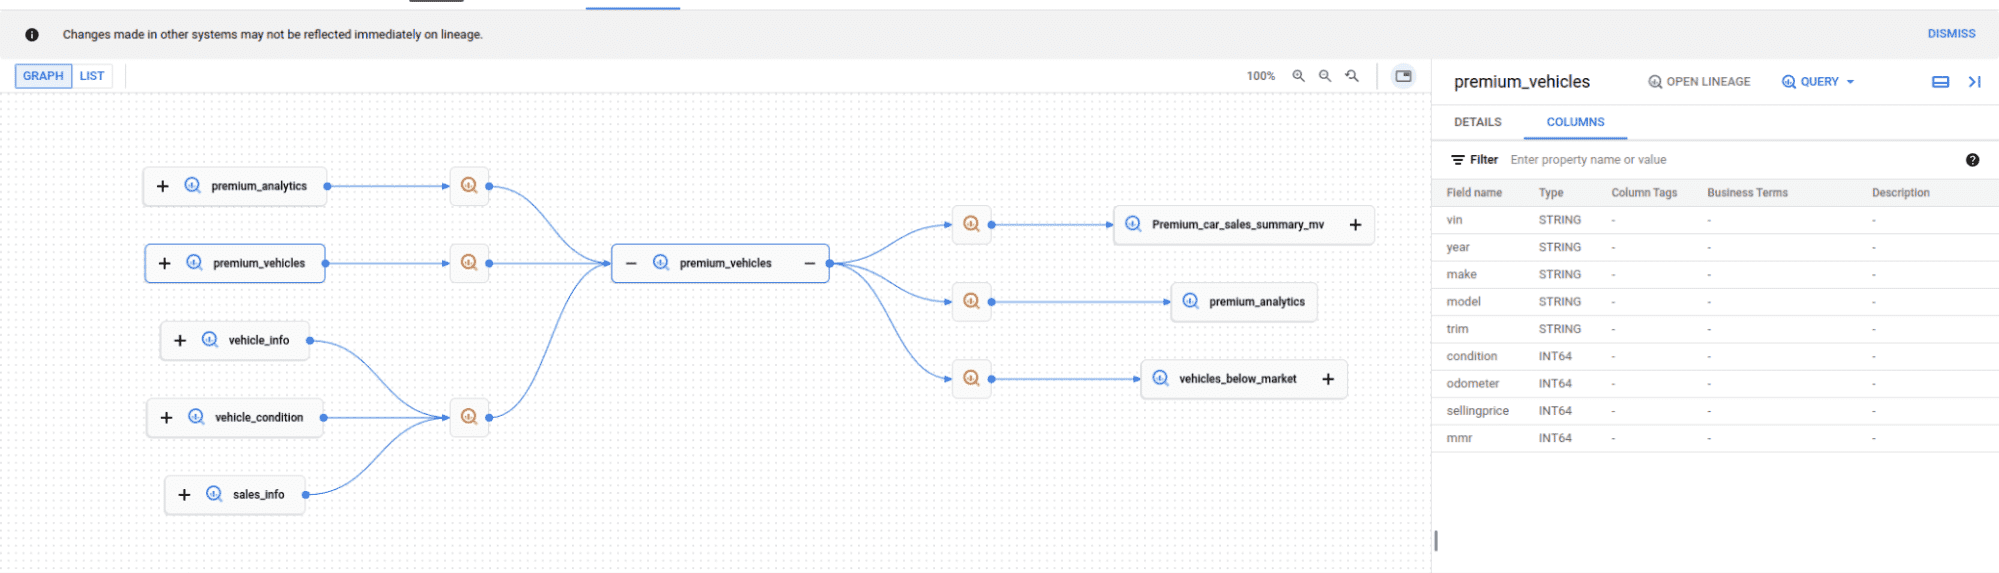
If you click on a table node the list of columns for the table is displayed.
The visualization also contains the SQL statements as separate nodes. In BigQuery speak these are called Processes
This is nice and a much better implementation than on Databricks where the SQL is represented and obfuscated as edges, which is not an accurate way of representing these objects.
By clicking on the query node BigQuery will display the actual SQL code
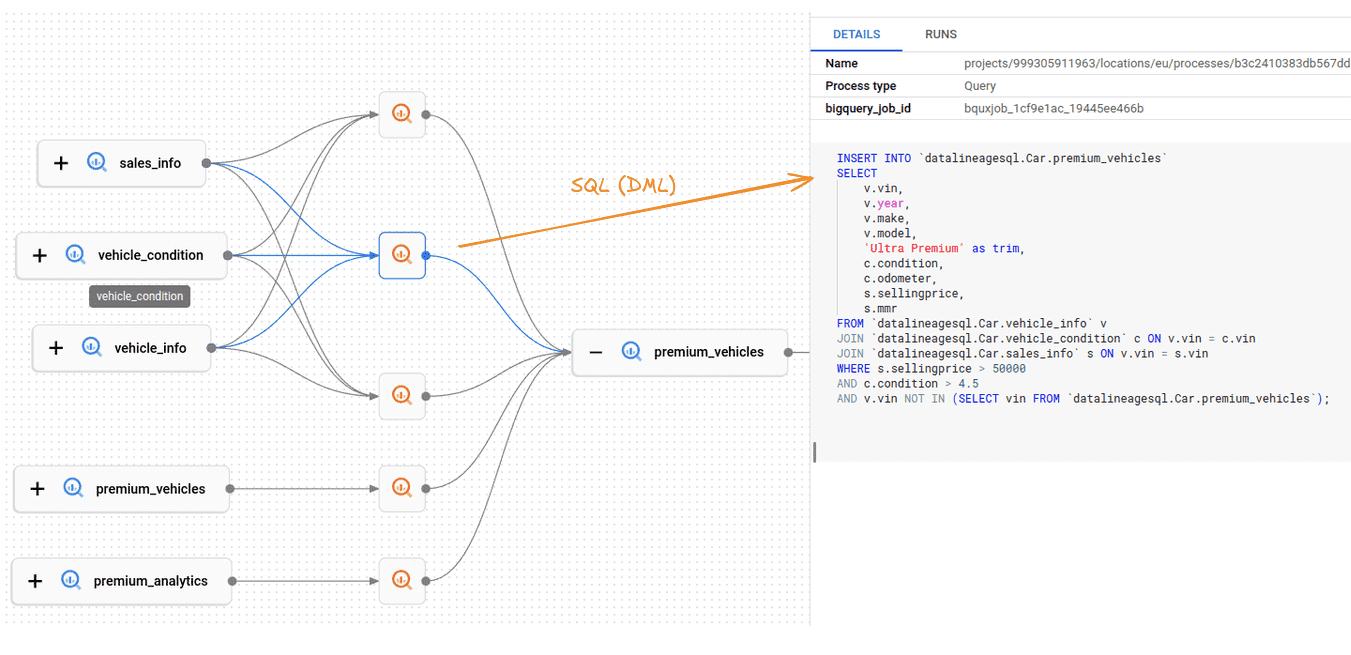
The code is nicely formatted and very easy to read.
For each query you can also display executions aka Runs
This information is helpful for understanding when the query was last run.
Data lineage not showing for your tables and SQL?
One common source of frustration for users of BigQuery lineage is that lineage does not show up.
The root cause for this behaviour is that it takes between 30 minutes to 24 hours for the lineage information to register inside the Dataplex data catalog.
There are other reasons why lineage may not show:
- The Data Lineage API is not enabled in either the active project or the compute project.
- Additionally, you may lack the Data Lineage Viewer role (roles/datalineage.viewer) in one or both of these projects.
List mode
In list mode you get the downstream lineage with parents (source) and children (target) and the depth.
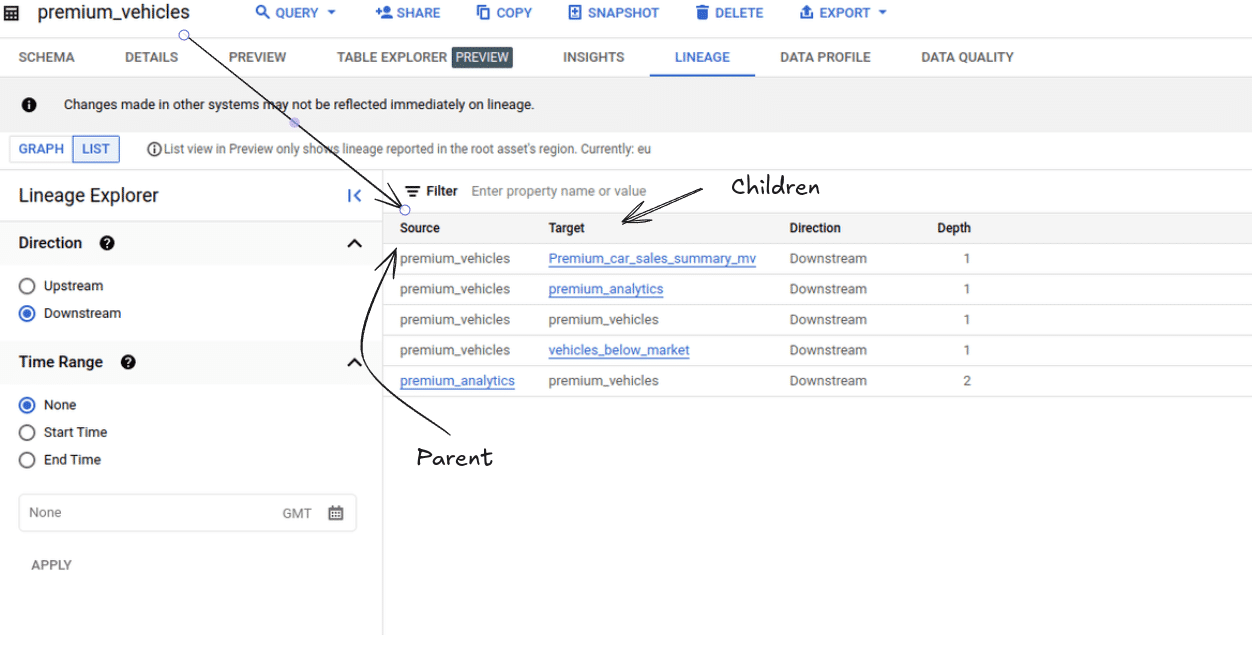
In this example, the anchor table premium_vehicles has three downstream tables, as shown at Depth Level 1. One of these tables, premium_analytics, acts as a parent table for an additional table further downstream at Depth level 2.
Data Lineage API in BigQuery
Overview of the Data Lineage API
GCP provides a REST API for data lineage. You can use the API to programmatically create lineage or to retrieve information about lineage.
The most important REST resources are the endpoints for Processes, Runs, and Lineage Events.
Here is a list of the common methods for each endpoint.
- create: Initiates a new process.
- delete: Removes a process by its specified name.
- get: Retrieves details of a specific process.
- list: Enumerates processes within a given project and location.
- patch: Modifies an existing process.
Using the BigQuery lineage API
I have put together some Python code that queries the lineage API.
Any references to object IDs such as the project ID I used have been obfuscated.
Let’s start with the pre-requisites.
Pre-requisites
|
1 2 3 |
import logging import os from google.cloud import datacatalog_lineage_v1 as lineage_v1 |
|
1 2 3 4 5 |
logging.basicConfig(level=logging.INFO, format="%(asctime)s - %(levelname)s - %(message)s") logger = logging.getLogger(__name__) client = lineage_v1.LineageClient() |
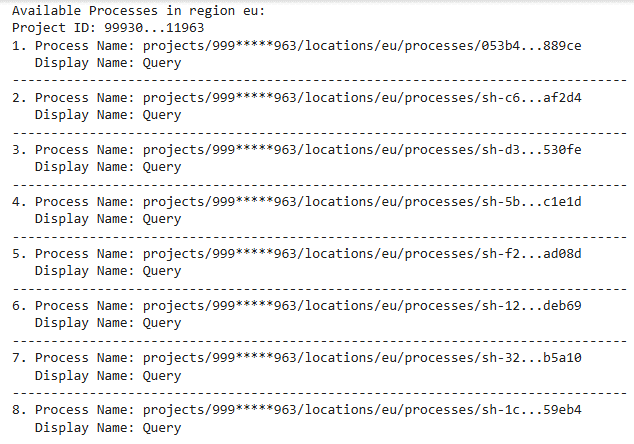
List processes
The method list_processes_simple retrieves and displays detailed information about lineage processes within a specified Google Cloud project (9993XXXXX963) and region (eu). The output includes Full names, display names,
|
1 2 3 4 5 6 7 8 9 10 11 12 13 14 15 16 17 18 19 20 21 22 23 |
def list_processes_simple(project_id, region): parent = f"projects/{project_id}/locations/{region}" try: processes = list(client.list_processes(parent=parent)) if not processes: print(f"No lineage processes found in region {region}.") return [] print(f"Available Processes in region {region}:") for i, process in enumerate(processes, 1): print(f"{i}. {process.name}") print(f" Display Name: {process.display_name}") print("-" * 80) return processes except Exception as e: logger.error(f"Error listing processes: {e}") return [] project_id = "999XXXXXX963" region = "eu" list_processes_simple(project_id, region) |
This gave me 8 processes of type Query.
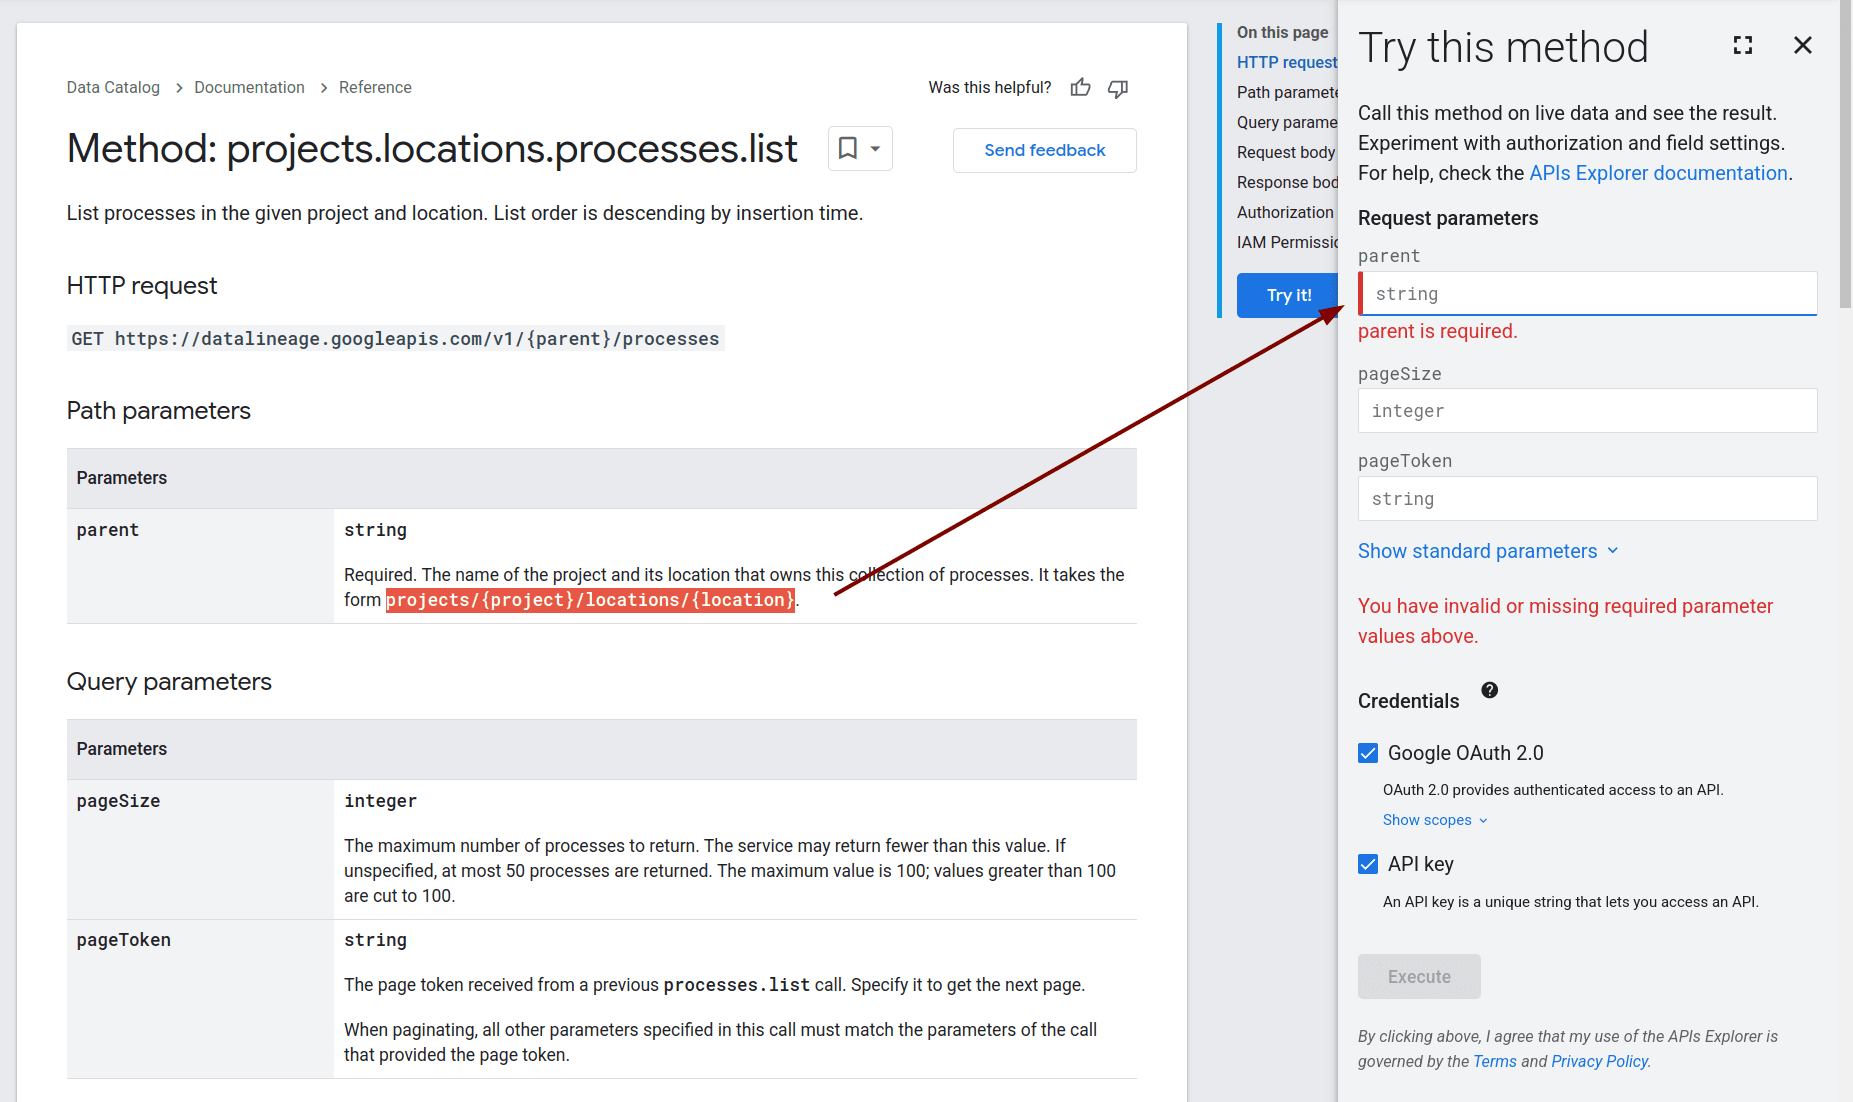
You can also use the API Explorer’s user interface to query the REST API and list Processes. This approach is particularly useful for testing purposes.
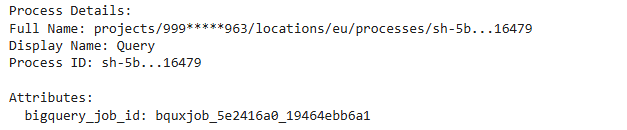
Retrieve Specific Lineage Process Details
The method get_process retrieves and displays detailed information about lineage processes within a specified Google Cloud project (999XXXXXX963), region (eu) and process_id = “sh-5bb260cfXXXXXXX126fd32ae1d16479”. I got the process_id in the previous step where I listed all of our processes.
The output includes the full name, display name, and the bigquery_job_id.
|
1 2 3 4 5 6 7 8 9 10 11 12 13 14 15 16 17 18 19 20 21 22 23 24 25 |
def get_process(project_id: str, region: str, process_id: str) -> None: process_name = f"projects/{project_id}/locations/{region}/processes/{process_id}" try: process = client.get_process(name=process_name) print("\n" + "="*50) print("Process Details:") print(f"Full Name: {process.name}") print(f"Display Name: {process.display_name}") if process.attributes: print("\nAttributes:") for key, value in process.attributes.items(): print(f" {key}: {value}") except Exception as e: logger.error(f"Error retrieving process: {str(e)}") return [] project_id = "999XXXXXX963" region = "eu" process_id = "sh-5bb260XXXXXXXXXXXXXX2ae1d16479" get_process(project_id, region, process_id) |
List Runs for a Process
Next I list the Runs for the Process. The method list_runs_for_process lists all runs associated with a specific lineage process. It retrieves the runs based on the provided process name.
|
1 2 3 4 5 6 7 8 9 10 11 12 13 14 15 16 17 18 19 20 21 22 23 24 25 26 |
def list_runs_for_process(process_name: str): process_name = f"projects/{project_id}/locations/{region}/processes/{process_id}" try: runs = list(client.list_runs(parent=process_name)) if not runs: print(f"No runs found for process {process_name}.") return [] print(f"\nAvailable Runs for process {process_name}:") for i, run in enumerate(runs, 1): print(f"{i}. {run.name}") print(f" Display Name: {run.display_name}") print("-" * 80) return runs except Exception as e: logger.error(f"Error listing runs for process: {e}") return [] project_id = "999XXXXXX963" region = "eu" process_id = "sh-5bb260XXXXXXXXXXXXXae1d16479" list_runs_for_process(process_name) |

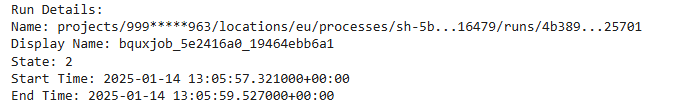
We see that only 1 Run is associated with this Process.
Retrieve Specific Run Details
This method get_run retrieves detailed information about a specific run associated with a lineage process. It outputs the run’s name, display name, state, start time, and end time.
|
1 2 3 4 5 6 7 8 9 10 11 12 13 14 15 16 17 18 19 20 21 |
def get_run(project_id: str, region: str, process_id: str, run_id: str): process_name = f"projects/{project_id}/locations/{region}/processes/{process_id}/runs/{run_id}" try: run = client.get_run(name=process_name) print("\nRun Details:") print(f"Name: {run.name}") print(f"Display Name: {run.display_name}") print(f"State: {run.state}") print(f"Start Time: {run.start_time}") print(f"End Time: {run.end_time}") return run except Exception as e: logger.error(f"Error retrieving run: {e}") return None project_id = "999XXXXXX963" region = "eu" process_id = "sh-5bb260XXXXXXXXXXXXXXae1d16479" run_id = "4b389271XXXXXXXXXXXXXXXX78f25701" get_run(project_id, region, process_id, run_id) |
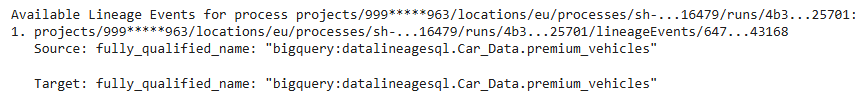
List Event Lineage
The method list_event_lineage function lists all lineage events associated with a specific lineage process. It provides details about each event’s source and target.
|
1 2 3 4 5 6 7 8 9 10 11 12 13 14 15 16 17 18 19 20 21 22 23 24 25 26 27 28 29 30 31 32 33 34 35 36 37 |
def list_event_lineage(process_name: str): try: events = list(client.list_lineage_events(parent=process_name)) if not events: print(f"\nNo lineage events found for process {process_name}.") return [] print(f"\nAvailable Lineage Events for process {process_name}:") for i, event in enumerate(events, 1): print(f"{i}. {event.name}") print(f" Source: {event.links[0].source}") print(f" Target: {event.links[0].target}") print("-" * 80) return events except Exception as e: logger.error(f"Error listing events: {e}") return [] def main(): def get_process_name(project_id: str, region: str, process_id: str, run_id: str) -> str: return f"projects/{project_id}/locations/{region}/processes/{process_id}/runs/{run_id}" project_id = "999XXXXXX963" region = "eu" process_id = "sh-5bb260XXXXXXXXXXXXXXae1d16479" run_id = "4b389271XXXXXXXXXX78f25701" process_name = get_process_name(project_id, region, process_id, run_id) list_event_lineage(process_name) if __name__ == "__main__": main() |
BigQuery Lineage Limitations: 3rd party lineage tools
BigQuery has three significant limitations
- No Column Lineage: BigQuery tracks table-level dependencies only, making it unsuitable for detailed transformation or column-level analysis. Without column lineage you will not be able to perform impact or root cause analysis. Column lineage is currently in private preview.
- Delayed Processing (up to 24 hours): Lineage updates are delayed by up to 24 hours, limiting real-time visibility into data flows and transformations.
- Limited Retention (30 days): Lineage metadata is stored for only 30 days, restricting historical tracking and long-term auditing.
Also consider the following limitations
- BigQuery does not automatically track lineage across third party tools such as ETL or BI tools.
- While you can import lineage from other systems this is a manual process in the sense that you need to write code to achieve it.
- BigQuery shows the SQL Processes that move data as separate nodes and not as edges. This is great but it does not let you drill into the SQL code and visualise that further. Inline views, subqueries, and complex SQL logic are critical components. End-to-end lineage must include these to give a complete picture of data flow. Our own tool FlowHigh SQL visualiser can visualise your SQL query code for debugging purposes.

Frequently Asked Questions (FAQ)
Can I use the BigQuery lineage feature with dbt and other ETL tools?
Yes. As dbt generates SQL that is pushed down into BigQuery it will be displayed in the lineage graph.
How long does it take for data lineage to show up in the lineage graph?
It can take between 30 minutes and 24 hours for lineage to show up. This is one of the various limitations of BigQuery lineage.
Why don’t my tables or SQL statements appear in the visual lineage graph?
There are a few possible reasons for this, but the most common one is timing. BigQuery may take some time to record and process lineage information, so it can take up to 24 hours for the data to appear in the visual graph.
For a detailed list of potential issues and troubleshooting steps, Google provides a comprehensive guide on common reasons why lineage might not display in BigQuery.
Can lineage track external systems feeding into BigQuery?
Yes. You can use the BigQuery API to programmatically create and import data lineage from external sources.
Does BigQuery support both table and column lineage?
As of January 2026, BigQuery does not support data lineage at the column level.
Useful posts and links
You can check how BigQuery stacks up against lineage on Snowflake and lineage on Databricks.
Uli Bethke
Uli has been rocking the data world since 2001. As the Co-founder of Sonra, the data liberation company, he’s on a mission to set data free. Uli doesn’t just talk the talk—he writes the books, leads the communities, and takes the stage as a conference speaker.
Any questions or comments for Uli? Connect with him on LinkedIn.
Follow Uli Bethke: