Databricks Data Lineage – API, Tables, Unity Catalog
In this blog post, I’m taking the Databricks data lineage feature for a test ride. Let’s see what it can do and where you might need to rely on a dedicated data lineage tool.
First, I’ll start with the basics. I’ll give you a high-level overview of what data lineage in Databricks actually is and why it’s important. Then, I’ll zoom out a bit and put it into context by looking at how it fits into the bigger picture – specifically, the Unity Catalog.
Once we’ve set the stage, I’ll walk you through the three ways you can access data lineage in Databricks. The first is via System Tables, where you can query lineage data directly. Next is the visual diagram, which gives you an interactive map of your data pipelines—think of it as a bird’s-eye view of your workflows. Finally, there’s the RESTful API, perfect for scenarios where you need automation and programmatic access.
In the last part of this post, I’ll get into the nitty-gritty details and limitations in Databricks data lineage. It’s not always enough for every use case. I’ll highlight scenarios where you will need a third-party data lineage solution to hit your goals.
So, let’s dive in and see what Databricks’ lineage feature is made of!
For those of you in a mad rush, I have compiled the key takeaways.
Databricks Data Lineage in a nutshell
Data Lineage in Databricks is part of the Databricks Unity Catalog. Unity Catalog is a metadata store used to manage metadata in Databricks.
Databricks gives you three options to access data lineage.
A REST API provides programmatic access to column and table level lineage.
Two System tables provide programmatic access to column and table data lineage through SQL.
Databricks also provides a visual diagram to browse data lineage based on the neighbourhood view paradigm.
As of December 2024, I have noticed several limitations in Databricks’ data lineage implementation.
- The API is restricted to providing information about immediate upstream and downstream nodes. For example: If you query the lineage of a table, the API will only return the direct dependencies (parents and children) but not the complete lineage chain. This limitation makes it challenging to get a comprehensive view of the entire lineage graph programmatically. You would need to repeatedly query the API to build a full picture.
- To overcome the API’s one-level limitation, you must manually query System Tables to retrieve deeper dependencies. However, Databricks lacks support for recursive SQL or Common Table Expressions (CTEs), forcing you to write complex, iterative scripts. This significantly increases manual effort and the risk of errors.
- The current implementation does not capture lineage for UPDATE and DELETE operations, leaving gaps in tracking dependencies and limiting the ability to understand the full data pipeline.
- The visual diagram provides an incomplete picture by omitting the actual logic or code behind data transformations, reducing its value for debugging or documentation.
- To overcome these limitations you will need to turn to a dedicated data lineage tool.
- Databricks lineage does not track the dependencies of individual SQL statements such as nested subqueries or database views. An SQL query visualiser can help you track intra query dependencies.
Let’s start with a quick intro to the concept of data lineage.
Use Flexter to turn XML and JSON into Valuable Insights
- 100% Automation
- 0% Coding
What is data lineage?
Hundreds of articles have been written about data lineage. Rather than adding more text to this I will paint a picture for you. Or even better a map. An Open Street Map (OSM). Just like OSM helps you find your way around when exploring a city or find the next petrol station on a roadtrip, data lineage helps you find your way around a data pipeline. It organises your data flows and data nodes into dependencies and shows you how everything hangs together.
Here’s a comparison table highlighting how a map, like OpenStreetMap, relates to data lineage.
Purpose
| Map | Data Lineage |
|---|---|
Helps individuals understand where things are and how to get from one location to another. | Helps organisations understand where data comes from, how it moves, and where it ends up. |
Provides visibility into physical routes and pathways. | Provides visibility into data transformations, workflows, and dependencies. |
Key Components
| Map Components | Data Lineage Components |
|---|---|
Locations: POIs, Cities, landmarks, etc. | Data stores: tables, files, data sets |
Paths/Routes: Roads, highways. | Data Flows: The movement of data, e.g. SQL code to move data |
Waypoints: Stops along a route. | Transformations: Intermediate steps where data is cleaned, aggregated, or processed. |
Legends/Keys: Explain symbols. | Metadata: Describes the meaning, changes, and relationships of the data. |
Data lineage and the Unity Catalog
Data lineage in Databricks is part of the Unity Catalog.
Unity Catalog covers the following use cases
Enterprise Data Governance: Enforce data access policies and maintain compliance with regulations.
Data Discovery: Enable data teams to discover and explore datasets.
Data Sharing: Share datasets securely with third parties using Delta Sharing.
Auditability: Track data transformations and usage for audits and troubleshooting.
Unity Catalog is mainly used for managing data assets inside Databricks even though it is possible to integrate with foreign catalogs.
Microsoft Purview vs Unity Catalog
If you need to manage metadata across multiple data platforms, BI tools, and databases Microsoft Purview can complement the Unity Catalog as it provides much wider support for managing lineage and metadata across multiple tools and platforms
Open Source (OSS) Unity Catalog
It’s important to distinguish between the open-source Unity Catalog and the Databricks Unity Catalog, as they are significantly different.
The Databricks Unity Catalog focuses on data governance and includes features like data lineage. In contrast, the open-source Unity Catalog acts primarily as a metastore for managing various table formats, such as Iceberg and Delta Tables. Unlike the Databricks version, the open-source Unity Catalog does not offer data governance capabilities.
Data lineage in Databricks
Now that you know the most important bits about data lineage and the wider context of the Unity Catalog, let’s explore data lineage inside the Databricks platform. Data engineers, data analysts, and data scientists use lineage to track the dependencies of data sets (think tables) and data flows (think SQL) in a data pipeline.
Databricks announced its lineage feature in June 2022 and it became GA in December 2022.
Together with Snowflake, Databricks is one of the few data platforms with built in native support for data lineage and a data catalog.
Data lineage works for standard objects such as tables but can also be used to track the dependencies of ML models.
Databricks tracks the lineage inside the Query Editor, Notebooks, Workflows, Dashboards and Pipelines.
Development tools that trace data lineage in Databricks
- Query Editor: An editor for writing and executing SQL queries to explore and analyse data in Databricks.
- Notebooks: Interactive documents that combine code, visualisations, and markdown, supporting multiple programming languages like Python, Scala, SQL, and R.
- Workflows: A feature for orchestrating and automating tasks, such as running jobs, pipelines, or notebooks in a scheduled or triggered manner.
- Dashboards: Visual representations of data and insights created from notebook outputs or queries for sharing and monitoring.
- Pipelines: Tools for building and managing ETL workflows using Delta Live Tables to ensure efficient, reliable data transformation.
How can I access data lineage in Databricks?
Data lineage in Databricks comes in three flavours.
API: Provides programmatic access to lineage information, allowing users to extract and integrate data lineage details into custom tools or workflows.
System Tables: Stores lineage metadata in Databricks system tables, enabling SQL-based queries for tracking data flow and transformations.
Visual Graph: An interactive, visual representation of data lineage that displays the relationships and flow of data across notebooks, jobs, and pipelines.
What type of DML and DDL is in scope for lineage?
DML and DDL coverage depends on how you access data lineage. The behaviour differs between the API, System Tables and the visual data lineage DAG.
DML
Let’s begin with the limitations and check the DML operations that are not supported by any of the three types of data lineage: the API, the System Tables, or the visual lineage graph.
- UPDATE: Lineage information is not captured for UPDATE operations.
- DELETE: Similar to updates, lineage is not available for DELETE operations.
- INSERT VALUES: Lineage information is not captured for INSERT VALUES operations.
I think this is a significant limitation as these are common operations in a data pipeline. The impact may be a broken or at least incomplete lineage graph
What about MERGE and SELECT?
- MERGE: Lineage information is not captured for MERGE operations by default. However, you can turn on lineage capture for MERGE operations by setting the Spark property spark.databricks.dataLineage.mergeIntoV2Enabled to true. Based on the documentation this will have a performance impact. I did not test the exact nature of the impact but it could be significant.
- SELECT: The SELECT statement is only supported when you are using the System Tables to query data lineage. It does not show up for the lineage API or the lineage visualisation.
Databricks has full data lineage support for CREATE TABLE AS (CTAS) and INSERT INTO SELECT (IIS).
DDL
When it comes to DDL standard objects such as tables, UDFs, materialised views, delta live tables, and views are included in data lineage. I noticed one small issue worth mentioning. You can’t create a Materialised View inside a Notebook and no lineage is displayed as a result.
Visual data lineage graph
In Databricks, you can visualise the DAG (Directed Acyclic Graph) of your data pipelines directly in your browser.
When it comes to visualising a pipeline or DAG, you have two common choices.
- View the entire pipeline at once, or
- Focus on a specific part of the pipeline and explore step by step.
Databricks uses the second method, known as the neighbourhood view, to help you focus on what’s most relevant. You start by selecting a dataset, such as a table. This dataset becomes the anchor node, anchoring the visualisation. Databricks then shows you the immediate upstream and downstream nodes connected to this dataset.
From there, you can interact with the pipeline by expanding nodes step by step. You can trace data dependencies, navigate upstream to see where data comes from, or move downstream to understand where it flows next. This approach ensures you only see the parts of the pipeline you’re interested in, keeping the visualisation manageable.
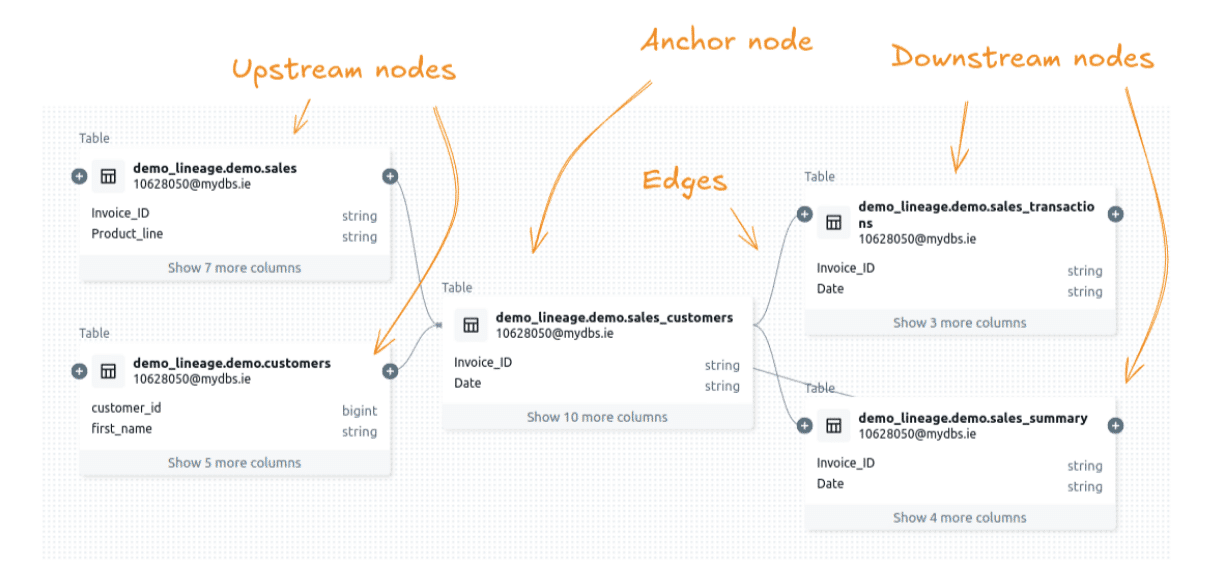
Neighbourhood view for visual data lineage graph
Both Snowflake and Databricks use the neighbourhood view for visualising data lineage. Here is a list of the pros and cons of the neighborhood when viewing a data pipeline
- Simplifies Complexity: Focuses on immediate connections. Makes it easier to interpret large graphs.
- Scalable: Handles large datasets without overwhelming the user or system.
- Efficient: Faster rendering and lower resource usage since only part of the graph is displayed.
- Clear Dependencies: Highlights upstream and downstream relationships for quick debugging or analysis.
- Interactive Navigation: Allows step-by-step exploration, reducing cognitive load.
- Limited Context: Does not show the entire graph, making it hard to understand the overall structure.
- Time-Consuming: Requires repeated expansions to explore multiple levels or nodes.
- Anchor Node Dependence: Insights rely heavily on the chosen starting point.
- Challenging Analysis: Global patterns and metrics like connectivity or bottlenecks are harder to identify.
Accessing the data lineage graph
I have compiled some step by step instructions for accessing the visual data lineage in Databricks.
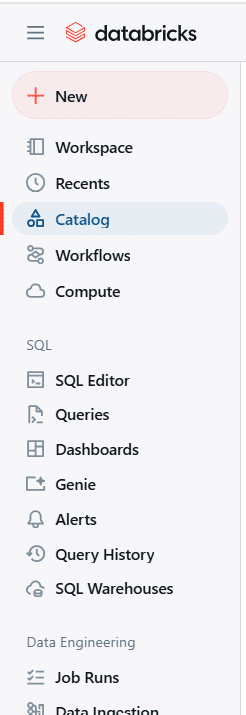
Step 1: Click on Catalog
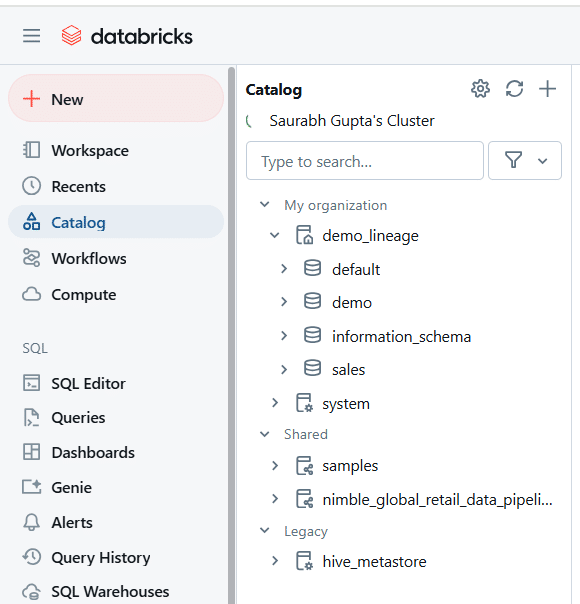
Step 2: Select the Schema where Pipeline is Built (Eg: Sales)
Step 3: Select the Table for Lineage, e.g. Supermarket_Sales
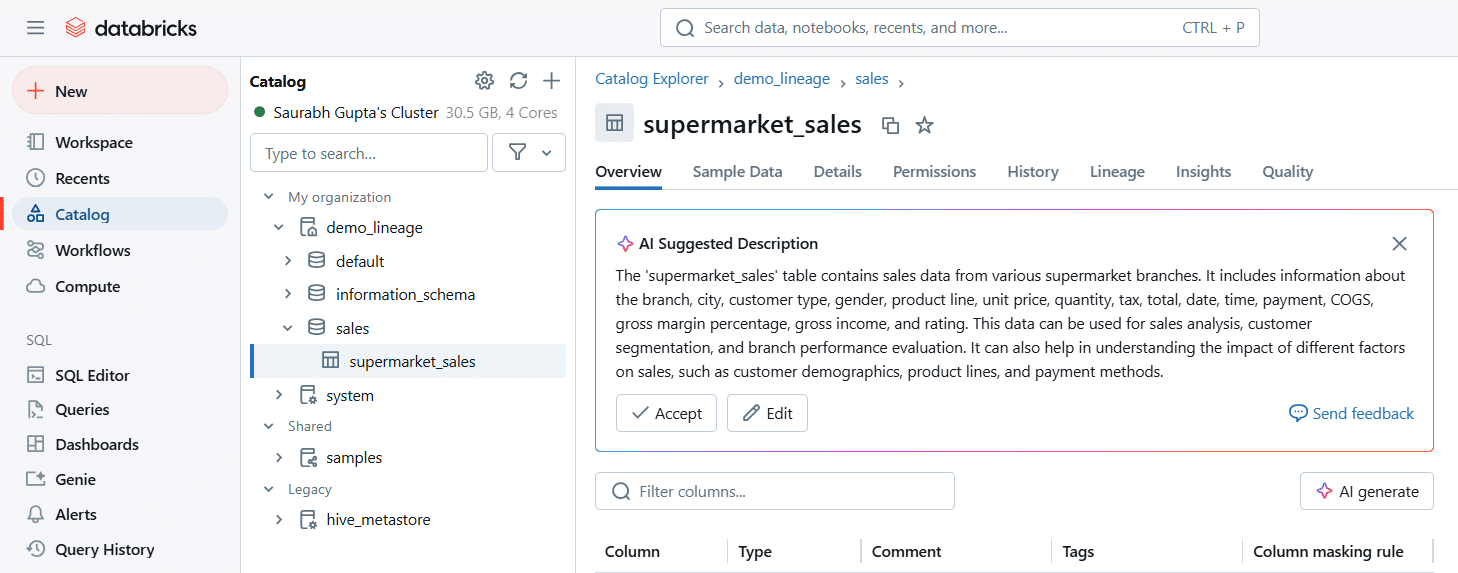
Step 4: Click on the Lineage tab
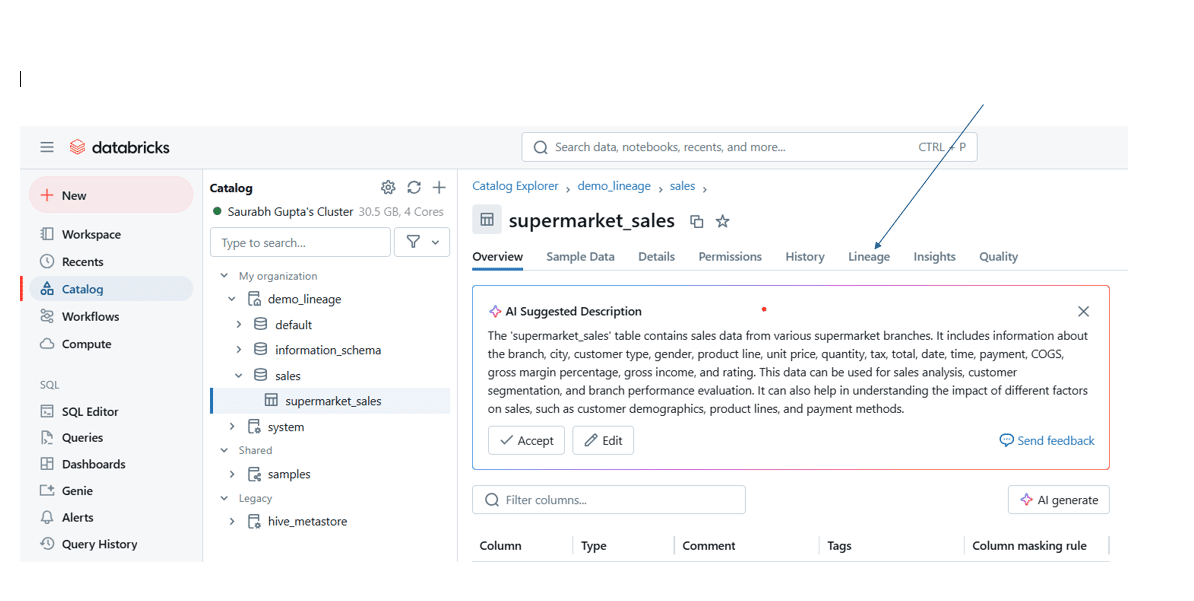
Step 5: Click on the See Lineage Graph button
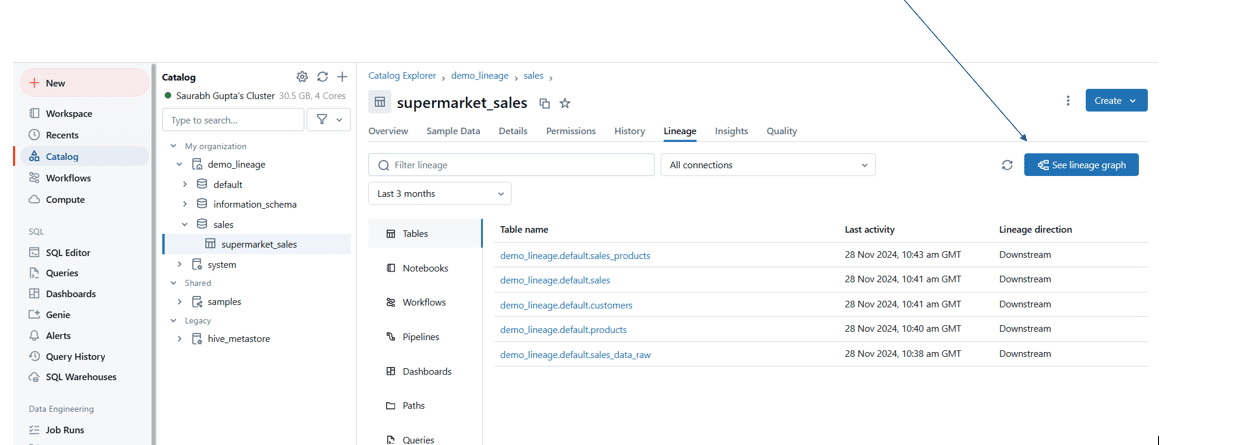
Using the data lineage visualisation
Step 1: Open the Lineage Graph
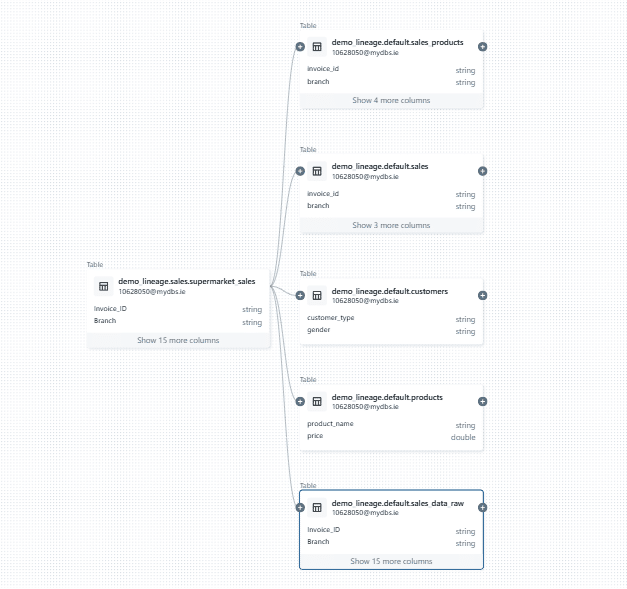
Step 2: Click on the (+) Sign to extend the Lineage to see connections between tables
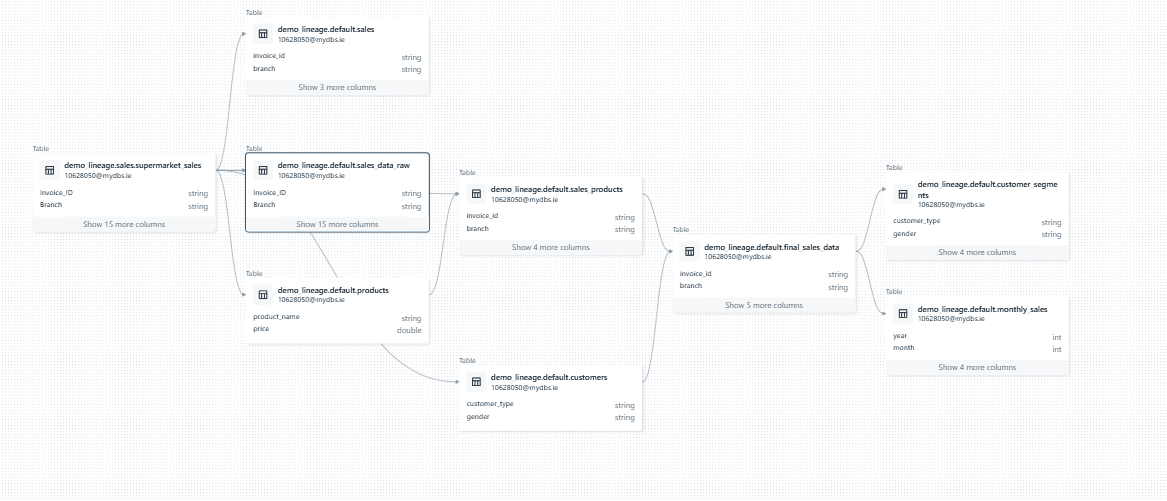
I came across a particularly annoying limitation in the way the data lineage graph handles the expand (+) icon next to dataset nodes. The purpose of this icon is to allow users to expand the diagram and show upstream or downstream nodes for a given dataset. However, in many cases, clicking the icon led to………. Nothing. It simply didn’t do anything. This creates confusion and disrupts the user experience. The presence of the icon suggests that additional nodes exist. A more intuitive design would hide the icon entirely when there are no upstream or downstream nodes to display, preventing unnecessary clicks and improving usability.
From what I can tell, the issue lies in how Databricks calculates these dependencies. They’re only resolved at runtime when you click the icon, which also explains the noticeable delay when expanding a node.
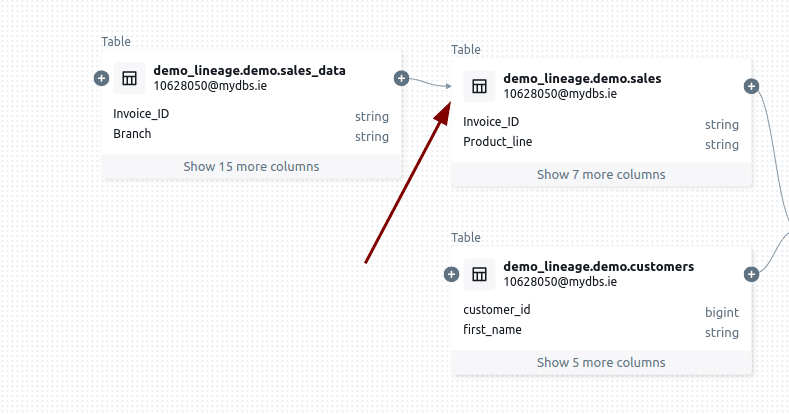
Databricks displays a plus icon beside the sales_transactions table.
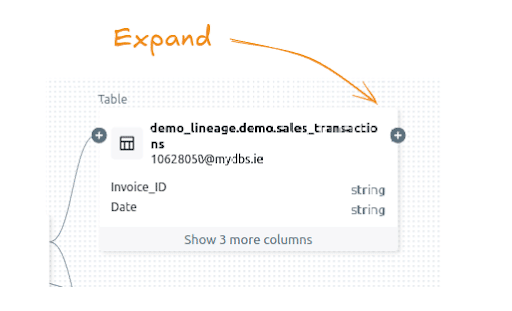
Nothing happens when clicking on the plus icon to expand the node downstream.
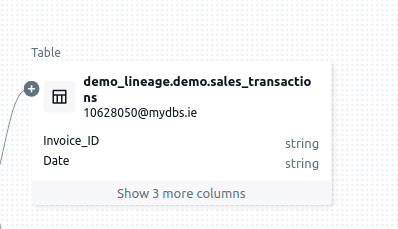
One of the more frustrating things I’ve come across is the inability to collapse a node after expanding it. Once a node is expanded, it stays that way, leaving the graph cluttered and harder to navigate—especially in large, complex lineage diagrams. This, combined with the earlier issue of the unresponsive expand (+) icon, makes working with lineage graphs far more tedious than it should be. It feels like these limitations turn what should be a powerful visualisation tool into a source of frustration.
Expanding table sales downstream
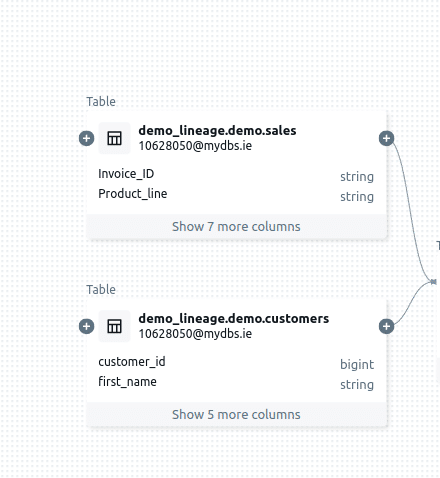
No minus icon to collapse
Viewing column lineage
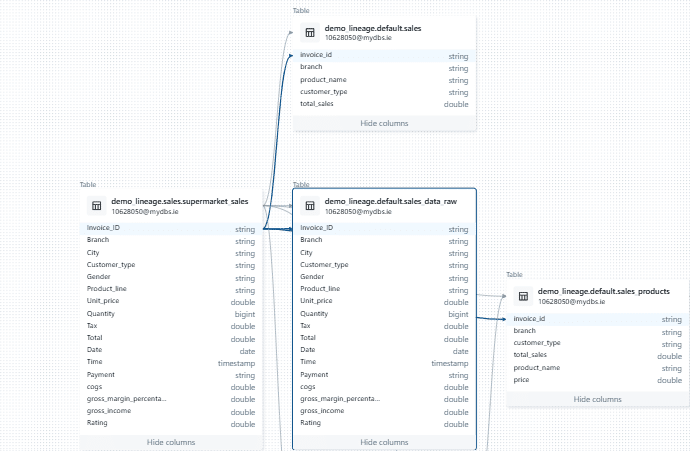
You can view column-level lineage in the data pipeline visualisation, which sounds promising at first. However, I ran into a major limitation: the lineage only extends one level up and one level down from the selected column.
In my opinion, this constraint significantly undermines one of the most important use cases for column-level lineage: impact and root cause analysis. To be truly effective, such an analysis needs to trace the lineage all the way back to the roots when going upstream or follow it down to the leaves when going downstream. Without this capability, the feature feels incomplete, more like a box-ticking exercise to claim column-level lineage support than a helpful feature for real-world problems.
Anyway, here is how you view column level lineage.
Step 1: Click on the Show more columns
Step 2: Select the column for which Lineage is required, e.g. invoive_id. As you can see an arrow has been added for both upstream and downstream columns of column invoice_id
Exploring node details
When you click on a node in the lineage graph you get some additional information about the table.
On the right hand side a new pane opens that shows us any columns that are a part of the table Columns Details:
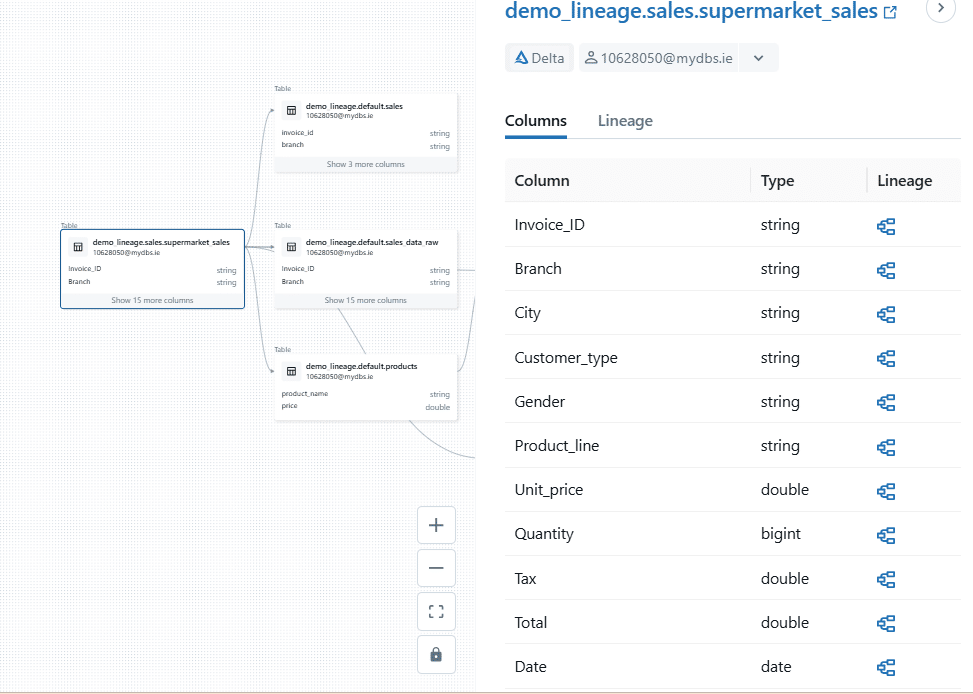
When you click on the Lineage tab, you uncover detailed information about where the table appears. Databricks lists all related objects, such as Notebooks, Workflows, and Query Editor windows. Arrows next to each object show whether the table acts as an upstream source or a downstream target.
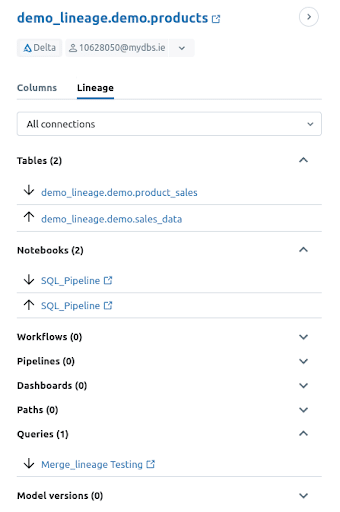
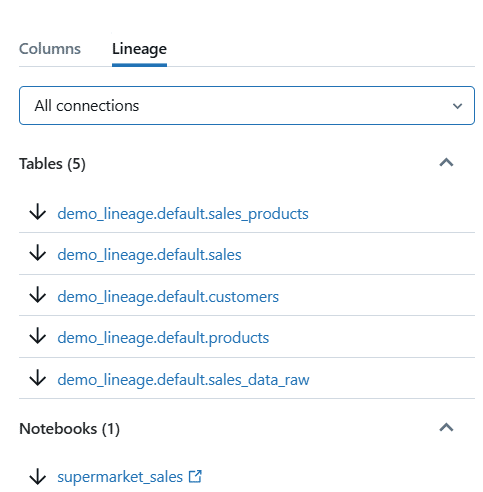
You can also filter Lineage by
- Upstream Connections
- Downstream Connections
- All Connections
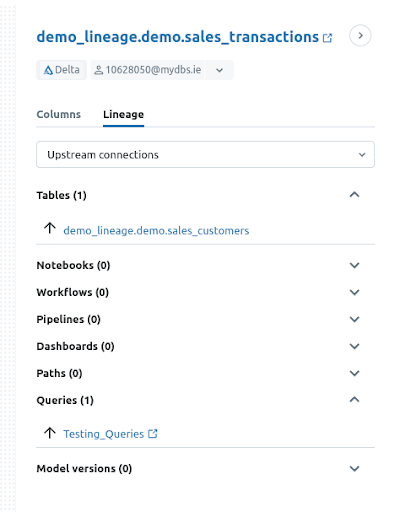
Filtering by Upstream connections shows only the immediate upstream dependencies, limited to one hop in either direction.
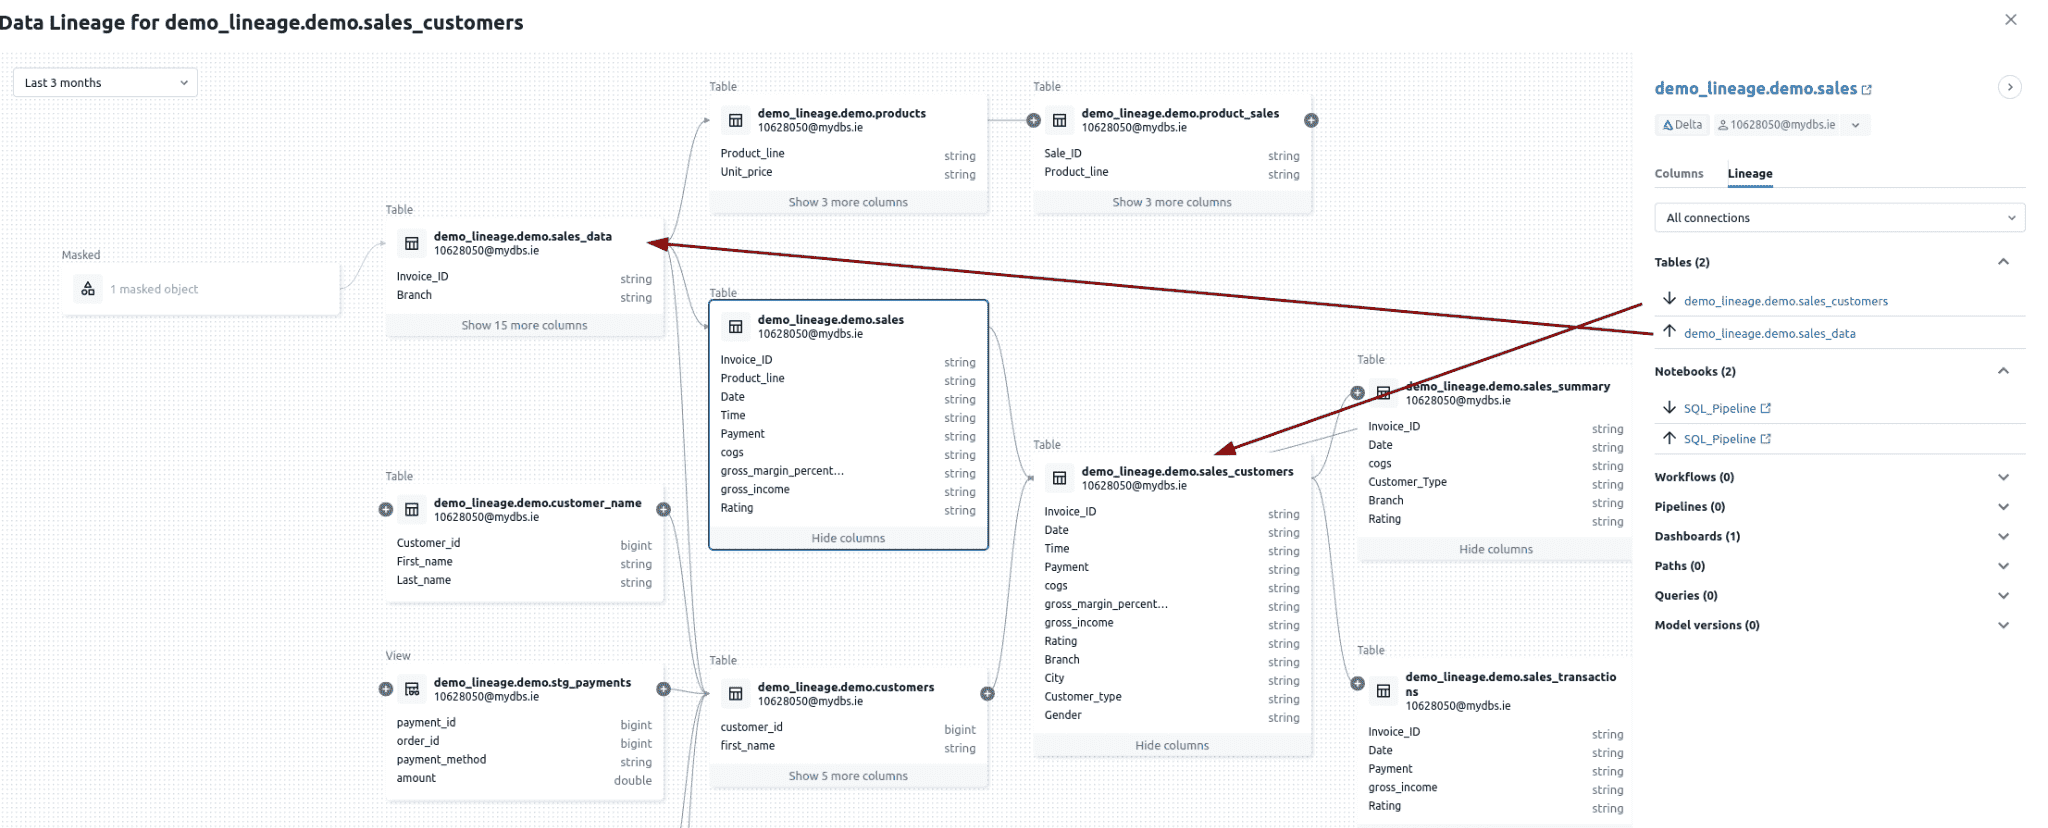
Exploring edge details
In data lineage visualisations, the line connecting upstream and downstream nodes—such as tables or datasets—is called an edge. This term comes from graph theory, where it represents the connection or relationship between two entities, known as nodes. In the context of data pipelines, an edge shows how data flows or how one dataset depends on another.
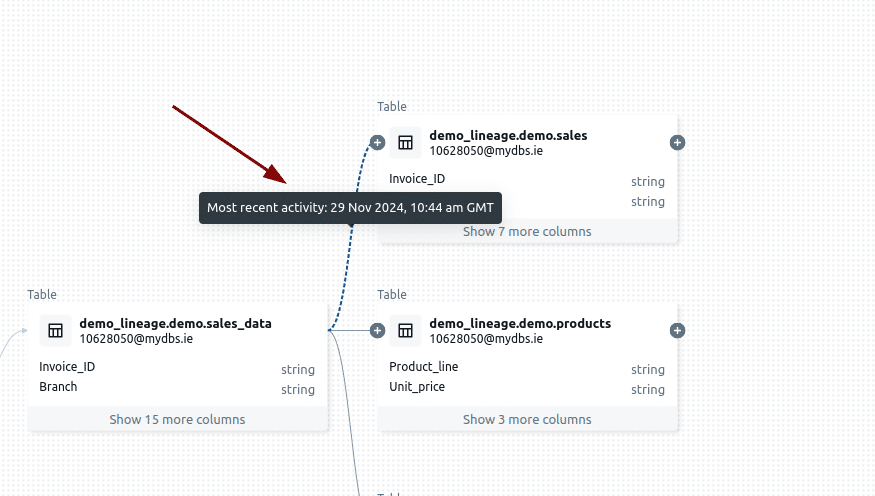
When you hover over an edge, you can see details about the most recent activity between the connected nodes. Databricks highlights the last SQL operation executed on the dependent dataset and displays it for reference.
When you click on an edge connecting two nodes you see more information about the Lineage Connection such as the Source, Target and where the SQL was used.
In my example the source is table sales_data. The target is table sales and the SQL was captured from a Notebook.
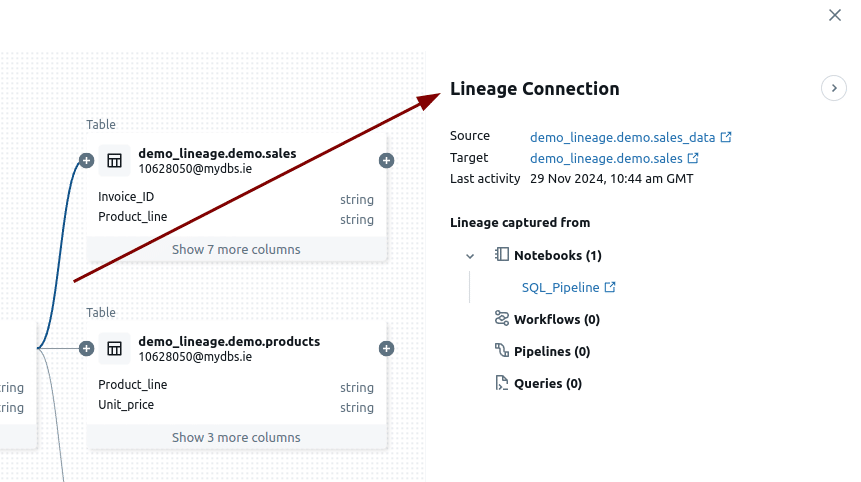
What I found frustrating, though, is that the actual SQL code is missing from the lineage view. Sure, you can click on the link to the Notebook to find it, but this forces you into a context switch. A new window pops up with the Notebook, and then you have to sift through the code to locate the specific SQL you’re after. This process feels clunky and unnecessary. Imagine how much smoother it would be if the lineage view simply displayed the SQL code that loads the target from the source(s) right there. No extra steps, no new windows, just the information you need.
Working with XML on Databricks? Convert and load it first, then use the system tables below to trace lineage. See our XML to Databricks guide.
Data lineage in System tables
You can dive into Databricks data lineage programmatically through lineage System tables. Using these handy tables you can access both table-level and column-level lineage data
- system.access.table_lineage
- system.access.column_lineage
Important:
Before you can use the System lineage tables you need to enable them, otherwise they do not show up in the Catalog.
Enabling access to lineage tables
Use the following command to enable access to lineage System tables.
You need to provide the PAT Token, Workspace and Metastore ID together with the name of the schema (access) where the lineage tables are located.
|
1 |
curl -v -X PUT -H "Authorization: Bearer <PAT Token>" "https://<workspace>.cloud.databricks.com/api/2.0/unity-catalog/metastores/<metastore-id>/systemschemas/access" |
Once you have enabled access, the lineage tables will appear in the Catalog.
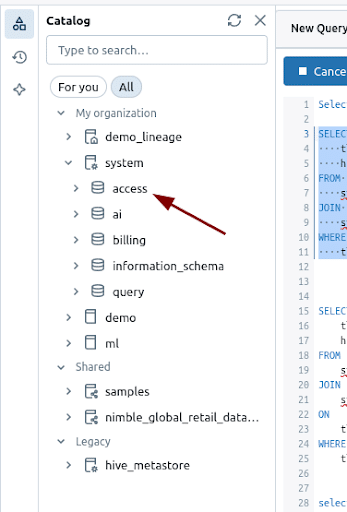
Lineage tables and query_history
To unlock even more insights, you can join these lineage system tables with the query_history system table to pinpoint the exact SQL code that was executed.
Just connect the statement_id in query_history to the entity_run_id in table_lineage or column_lineage, and voilà… you’ve got the full picture of your data’s journey, down to the query that made it happen!
entity_run_id is an ID to describe the unique run of the entity, or NULL. This differs for each entity type:
- Notebook: command_run_id
- Job: job_run_id
- Databricks SQL query: query_run_id
- Dashboard: query_run_id
- Legacy dashboard: query_run_id
- Pipeline: pipeline_update_id
- If entity_type is NULL, entity_run_id is NULL.
Not only for Writes but also for Reads
Unlike the visual lineage graph or the API, System tables also capture data lineage for Read only queries such as a SELECT statement.
Table lineage
System table table_lineage stores table level dependencies of SQL queries.
You can join this table to query_history to get the full text of your SQL statement
|
1 2 3 4 5 6 7 8 9 10 11 12 13 14 15 16 17 18 19 20 21 |
SELECT tl.entity_run_id, tl.source_table_full_name, tl.source_table_catalog, tl.source_table_schema, tl.source_table_name, tl.target_table_full_name, tl.target_table_catalog, tl.target_table_schema, tl.target_table_name, h.statement_text, h.statement_type, h.execution_status, h.statement_id, h.client_application FROM system.access.table_lineage AS tl JOIN system.query.history AS h ON tl.entity_run_id = h.statement_id WHERE tl.entity_run_id = '01efb0bc-abdc-1327-a6ab-2855fd7f090c'; |

Column lineage
System table column_lineage stores the column level dependencies of SQL queries.
You can join column_lineage to System table query_history to get to the source code of the SQL statement.
|
1 2 3 4 5 6 7 8 9 10 11 12 13 14 15 16 17 18 19 20 21 |
SELECT cl.entity_run_id, cl.source_table_full_name, cl.source_table_catalog, cl.source_table_schema, cl.source_table_name, cl.target_table_full_name, cl.target_table_catalog, cl.target_table_schema, cl.target_table_name, h.statement_text, h.statement_type, h.execution_status, h.statement_id, h.client_application FROM system.access.column_lineage AS cl JOIN system.query.history AS h ON cl.entity_run_id = h.statement_id WHERE cl.entity_run_id = '01efb0bc-abdc-1327-a6ab-2855fd7f090c'; |

In this particular scenario we filter by statement_id on the following SELECT query:
|
1 |
Select * from customers |
As you can see Databricks looks up the asterisk (*) against metadata to get the full list of column names for table customers.

Some limitations about System lineage tables
Databricks makes it easy to access data lineage for both READ (DQL like SELECT) and WRITE (DML like INSERT, CTAS) operations, which is a big win for understanding how data flows. Even better, the lineage comes in a structured format, so you don’t have to deal with parsing JSON arrays to get what you need.
But let’s talk about the downsides. Navigating upstream or downstream through the dependency chain in your data pipeline requires far too much manual effort. You will need to recursively iterate over the system tables. It’s a 100% manual effort. A much better approach would be to have an API that gives you the lineage upstream to the root nodes or downstream all the way to the leaf nodes. If you’re trying to perform impact analysis or root cause investigations, this process quickly becomes a headache.
And it doesn’t stop there. Databricks doesn’t support recursive SQL, such as recursive CTEs, making it even harder to automate these lineage queries. It’s a lot like the limitations in the lineage API (more on that in a minute), where you can only see one level up or down for a table or column.
Data lineage REST API
Some regions don’t have support for System tables. For this scenario and where you prefer an API over System Tables you can use the Databricks REST API for lineage.
Just like the lineage System tables, the REST API also supports table and column level lineage.
You submit a table or column name to the API and it will give you the tables or columns one level up and one level down
For table lineage you use the following command:
|
1 |
curl --netrc -X GET -H 'Content-Type: application/json' -H "Authorization: Bearer <Databricks access Token>" https://<DatabricksHost>/api/2.0/lineage-tracking/table-lineage -d '{"table_name": "<catalog>.<schema>.<table>", "include_entity_lineage": true}}' |
For column lineage you use the following command
|
1 |
curl --netrc -X GET -H 'Content-Type: application/json' -H "Authorization: Bearer <Databricks access Token>" https://<DatabricksHost>/api/2.0/lineage-tracking/column-lineage -d '{"table_name": "<catalog>.<schema>.<table>", "column_name":<ColumnName>}}' |
Explanation:
Databricks access token: This is a unique token used for authentication with the Databricks REST API.
Databricks host: This is the base URL of your Databricks workspace (e.g., https://<your-databricks-instance>.cloud.databricks.com).
<catalog>.<schema>.<table>: This specifies the full name of the table for which lineage is being tracked, including catalog, schema, and table names.
If you set Include_entity_lineage to true additional lineage information will be displayed.
ColumnName is the name of the anchor column to retrieve data lineage.
Limitations
You can’t control how many levels upstream or downstream to explore, which is a major limitation 😟. In practice, this forces you to create your own solution to recursively navigate the dependency graph 😭😱 via the provided API.
Examples for table lineage API
Lineage tracking for Table : Product_Sales
|
1 2 |
%sh curl --netrc -X GET -H 'Content-Type: application/json' -H "Authorization: Bearer dapi6bb2dd8332005e232d933b079bab90a6" https://dbc-8ca65963-24e4.cloud.databricks.com/api/2.0/lineage-tracking/table-lineage -d '{"table_name": "demo_lineage.demo.product_sales", "include_entity_lineage": true}}' |
Output:
|
1 2 3 4 5 6 7 8 9 10 11 12 13 14 15 16 17 18 19 20 21 22 23 24 25 26 27 28 29 30 31 32 33 34 35 36 37 38 39 40 41 42 43 44 45 46 47 48 49 50 51 52 53 54 |
{ "upstreams": [ { "tableInfo": { "name": "products", "catalog_name": "demo_lineage", "schema_name": "demo", "table_type": "TABLE", "lineage_timestamp": "2024-12-03 08:45:08.0" }, "notebookInfos": [ { "workspace_id": 3129790344425608, "notebook_id": 3495510163017277, "lineage_timestamp": "2024-11-29 11:10:49.0" } ], "queryInfos": [ { "workspace_id": 3129790344425608, "query_id": "ec15a793-9653-462b-a904-4a707b639548", "lineage_timestamp": "2024-12-03 08:45:08.0" } ] } ], "downstreams": [ { "notebookInfos": [ { "workspace_id": 3129790344425608, "notebook_id": 3495510163017277, "lineage_timestamp": "2024-11-29 12:03:13.0" } ] }, { "tableInfo": { "name": "product_sales_aggregate", "catalog_name": "demo_lineage", "schema_name": "demo", "table_type": "TABLE", "lineage_timestamp": "2024-11-29 11:12:36.0" }, "notebookInfos": [ { "workspace_id": 3129790344425608, "notebook_id": 3495510163017277, "lineage_timestamp": "2024-11-29 11:14:06.0" } ] } ] } |
As you can see you get the output for both upstream and downstream tables. You only get upstream and downstream dependencies for direct neighbours.
In this case we have one upstream and one downstream table each.
For each downstream table you also get information about the Query and Notebook where the table occurred.
|
1 2 3 4 5 6 7 8 9 10 11 12 13 14 |
"notebookInfos": [ { "workspace_id": 3129790344425608, "notebook_id": 3495510163017277, "lineage_timestamp": "2024-11-29 11:10:49.0" } ], "queryInfos": [ { "workspace_id": 3129790344425608, "query_id": "ec15a793-9653-462b-a904-4a707b639548", "lineage_timestamp": "2024-12-03 08:45:08.0" } ] |
Examples for column lineage API
Lineage tracking for column Product_line in table products
|
1 2 |
%sh curl --netrc -X GET -H 'Content-Type: application/json' -H "Authorization: Bearer dapi6bb2dd8332005e232d933b079bab90a6" https://dbc-8ca65963-24e4.cloud.databricks.com/api/2.0/lineage-tracking/column-lineage -d '{"table_name": "demo_lineage.demo.products", "column_name": "Product_line"}}' |
Output:
|
1 2 3 4 5 6 7 8 9 10 11 12 13 14 15 16 17 18 19 20 21 22 23 24 25 26 27 28 29 30 31 32 33 34 35 36 37 38 |
{ "upstream_cols": [ { "name": "Product_line", "catalog_name": "demo_lineage", "schema_name": "demo", "table_name": "sales_data", "table_type": "TABLE", "lineage_timestamp": "2024-11-29 10:43:33.0" } ], "downstream_cols": [ { "name": "Product_line", "catalog_name": "demo_lineage", "schema_name": "demo", "table_name": "product_sales", "table_type": "TABLE", "lineage_timestamp": "2024-12-03 08:45:08.0" }, { "name": "Customer_ID", "catalog_name": "demo_lineage", "schema_name": "demo", "table_name": "product_sales", "table_type": "TABLE", "lineage_timestamp": "2024-11-29 11:10:49.0" }, { "name": "Sale_ID", "catalog_name": "demo_lineage", "schema_name": "demo", "table_name": "product_sales", "table_type": "TABLE", "lineage_timestamp": "2024-11-29 11:10:49.0" } ] } |
The output shows that we have 1 column upstream and three columns downstream.
Looking at the visual lineage diagram confirms the correctness.
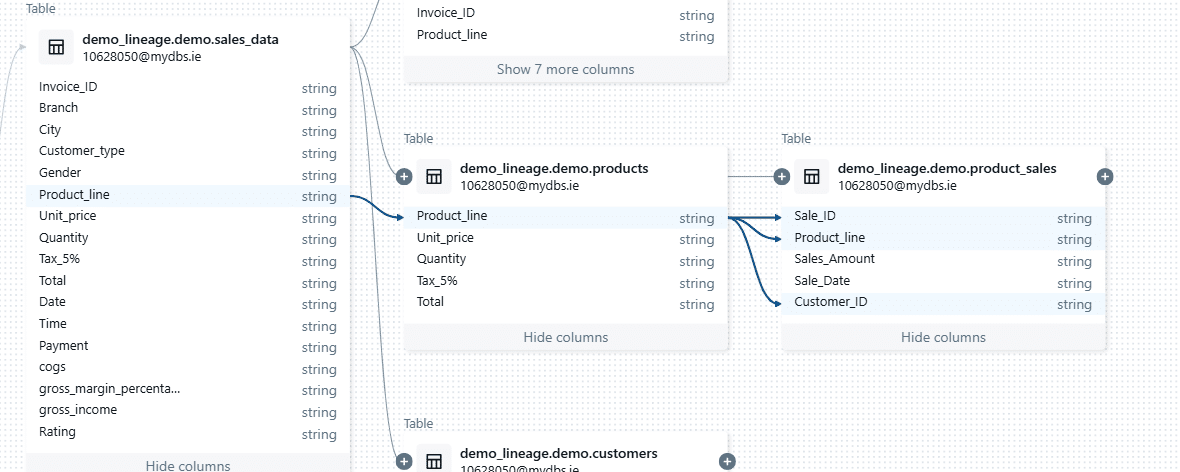
The output does not include information about notebooks or queries. To retrieve this, you need to make a separate API call for the table containing the column product_line.
Data lineage and foreign catalogs
Foreign catalogs in Databricks allow you to access external metadata and data resources that reside outside of the Unity Catalog. They act as a bridge to external data catalogs or systems. Here are some examples of support for foreign catalogs
- MySQL
- PostgreSQL
- Amazon Redshift
- Snowflake
- Microsoft SQL Server
- Azure Synapse
Foreign catalogs can be used for query federation, which means that you can run queries against one or more foreign catalogs and then stitch the results together inside Databricks.
How is this relevant for data lineage?
While the documentation mentions that you can retrieve data lineage from foreign catalogs it does not give any detailed steps on how to achieve this.
In theory you can bring your own data lineage from supported foreign catalogs to Databricks. However, it is unclear how this works in practice.
Data lineage for ML pipelines
Data lineage is not only available for standard data pipelines but also for ML pipelines and ML models you build.
To enable lineage Tracking for models you need to log your models with the method FeatureEngineeringClient.log_model. Once done, Databricks automatically captures and displays the lineage of feature tables and Python UDFs used in model computations.
Lineage Visualisation: You can view the lineage of feature tables, models, or functions by navigating to the page in Catalog Explorer and selecting the Lineage tab. This gives you a view of the data flow and the dependencies.
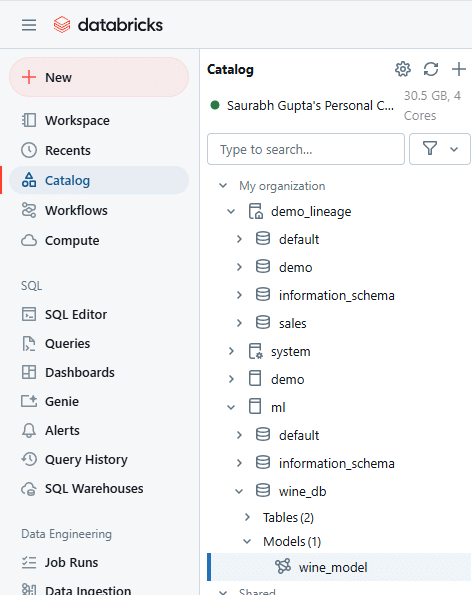
ML lineage is also tracked for upstream tables that feed into the model.

Recommended Reads:
Snowflake Data Lineage – Complete Guide
Latest Guide to BigQuery Data Lineage
When do you need a third-party data lineage tool for Databricks?
I will conclude this blog post with the limitations you will encounter in Databricks data lineage.
Databricks meets some basic requirements around data lineage. However, the features on offer are rather limited. Most companies will have more complex requirements than what Databricks has to offer.
As an example, a significant limitation is that DELETE and UPDATE operations are not handled. It means that you will be miss
Here are some more reasons you might need a third party data lineage tool that goes beyond the basics on Databricks.
1. Full Pipeline Overview
- You need a unique list of all data pipelines in your environment, not just the neighbourhood view.
- Neighbourhood views only show dependencies for a selected table, leaving you in the dark about the big picture.
2. Comprehensive SQL Visibility
- It’s not enough to see dependencies—you need to view the SQL that loads each node, such as a table.
- A full pipeline visualisation is essential, going beyond isolated anchor nodes or objects.
3. Automated Change Management
- True impact analysis involves more than just identifying dependencies.
- Example: Adding a column to a table may not cause immediate failures, but downstream processes like SELECT * queries could inadvertently pull unexpected data, leading to inaccuracies.
- Proper analysis traces the ripple effects, ensuring ETL jobs, views, and reports are updated to handle changes.
4. Multi-Hop Dependency Analysis
- Databricks stops at one hop upstream or downstream. You need a tool that goes deeper, automating recursion through the entire pipeline hierarchy.
5. Indirect Lineage Tracking
- Indirect lineage captures how changes, like modifying a WHERE clause or GROUP BY, affect downstream processes indirectly:
- Filtering rows in a WHERE clause could skew reports relying on this data.
- Adjusting a GROUP BY could alter result structures, causing failures or unexpected results downstream.
6. Cross-Platform Lineage
- Your organisation uses multiple databases, tools, and technologies, and you need to trace lineage across all of them—not just Databricks.
7. Non-Database Technologies
- You need to track lineage in ETL tools, BI dashboards, Excel files, and even custom Java code.
8. SQL Query Depth
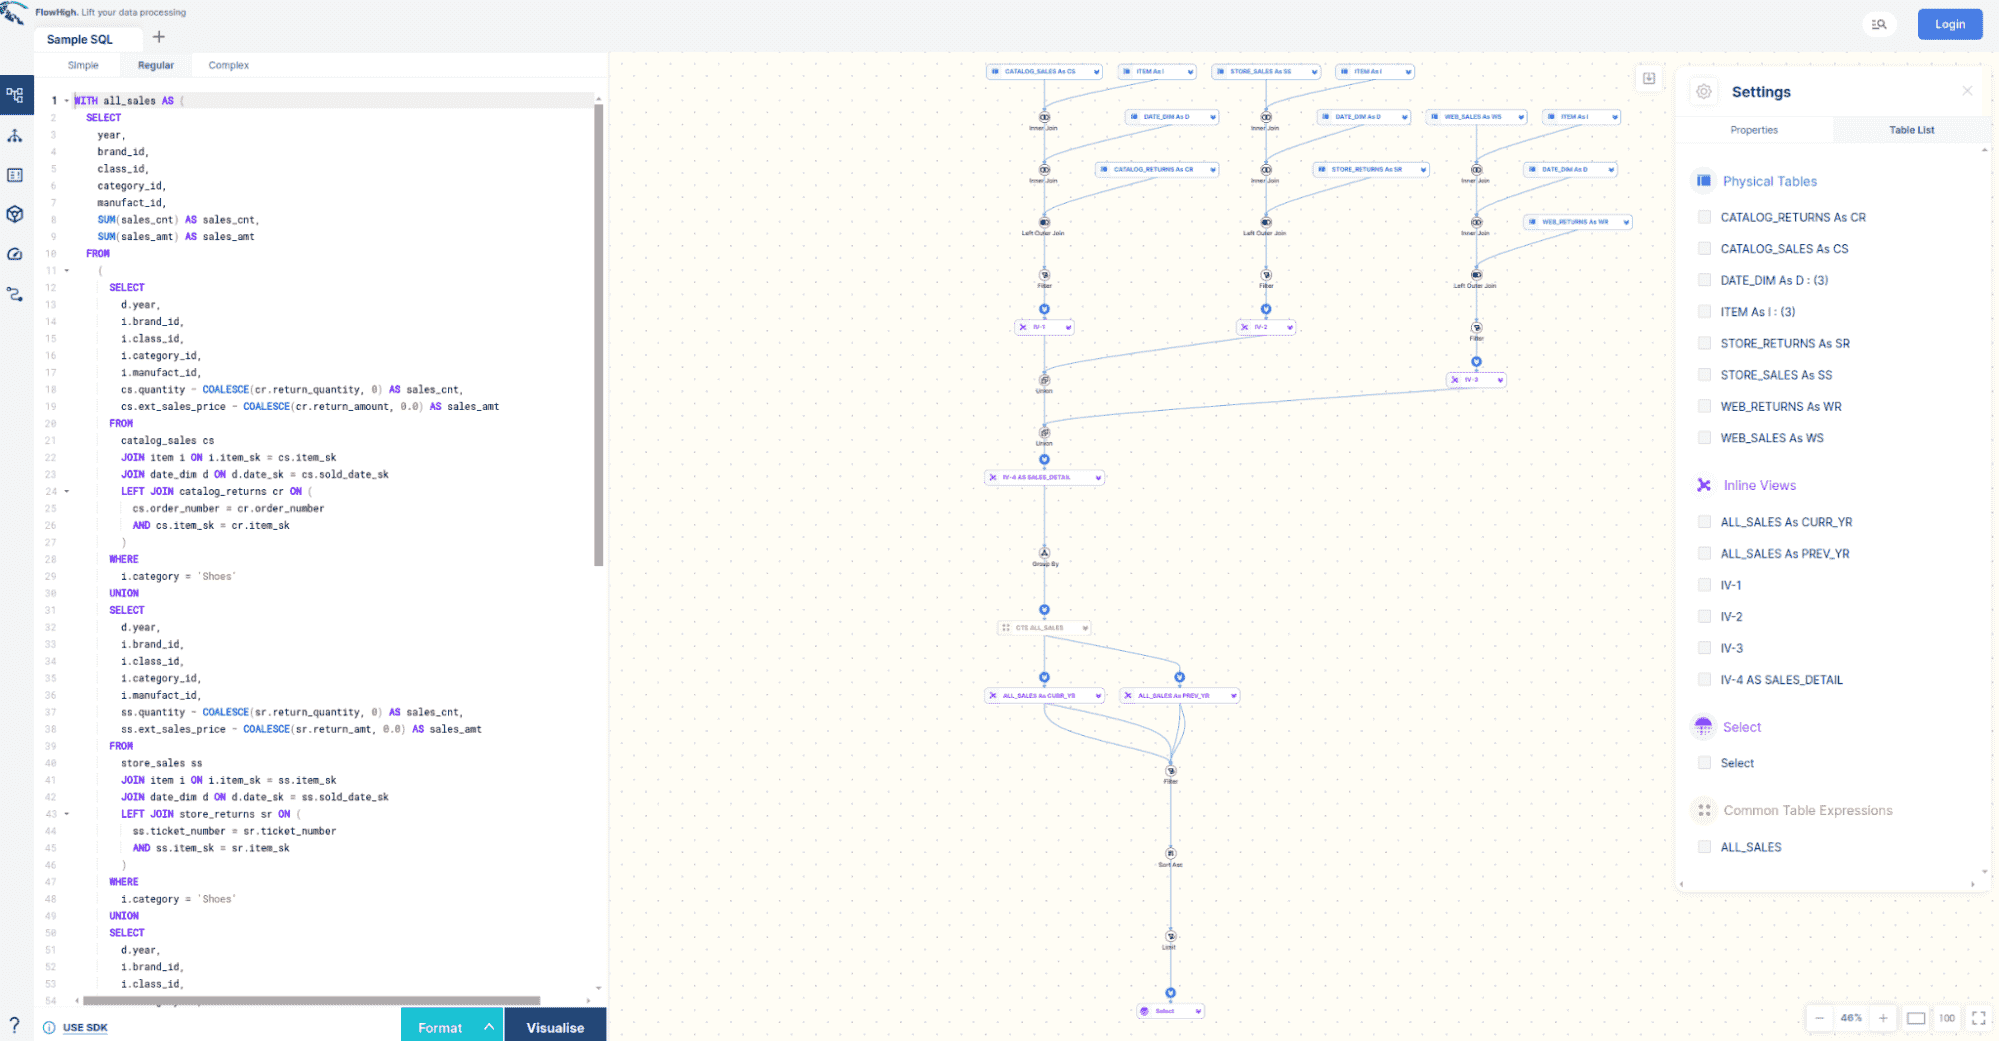
- Inline views, subqueries, and complex SQL logic are critical components. End-to-end lineage must include these to give a complete picture of data flow. Our own tool FlowHigh SQL visualiser can visualise your SQL query code.
