SQL Challenge: Tackling the Island Problem in Time Series Data


Jump into our SQL Challenge! Today, we’re exploring customer loyalty trends. Are you prepared to show off your SQL skills?
Use Flexter to turn XML and JSON into Valuable Insights
- 100% Automation
- 0% Coding
About the quiz
In this SQL pop quiz, we’re challenging you to demonstrate your understanding of islands in a time series data set. Whoever submits the correct and most performant query will be featured in our social media posts. They will also receive a mention and a link to their website in the blog post where we showcase the best solution.
We provide a basic solution to the problem. Try and beat it!
We are looking for a correct and optimized query for Snowflake. We will be using the TPCH_SF100 sample dataset that Snowflake provides to all accounts.
The most performant solution is based on the cost of the query. The cost is determined by the number of credits used. An example on how we calculate query cost is in the FAQ section at the end of the post.
Islands in time series explained
In the context of a time series of data, “islands” refer to contiguous sequences of data points that share a common attribute or condition. In simpler terms, Islands can be thought of as ranges comprising consecutive values without values being interrupted.
Some of the actual real life use cases for islands are:
Financial data analysis:
- Stock Price Analysis: An investor analyzes a company’s stock price over the past year and identifies a continuous three-month period where the stock price has been steadily increasing. This “island” of growth may indicate a positive market sentiment or successful company initiatives, prompting the investor to consider buying the stock.
- Revenue Trends: A business analyst detects an “island” of declining revenue over consecutive quarters. This pattern signals a need for the company to investigate potential causes, such as market changes or internal issues, and develop strategies to reverse the trend.
Customer Behavior Analysis:
- Loyalty Program Engagement: A retail store analyzes their loyalty program data and identifies customers who have made purchases every month for a year. Recognizing this “island” of consistent activity, the store might offer these loyal customers special rewards or exclusive deals.
- Subscription Service Renewal: A streaming service spots customers who have consistently renewed their subscriptions month after month without interruption. This pattern of loyalty can inform targeted marketing campaigns or loyalty perks to retain these subscribers.
Dataset Overview
We will be using the TPCH_SF100 sample dataset that Snowflake makes available for all accounts.
The TPCH_SF100 sample dataset is a rich source of transaction processing data, with an array of tables and interrelationships. Our focus for this challenge is the orders table, which records details of customer orders, including the date each was placed.
Problem
Your goal is to identify customers who have placed orders at least once every month for at least three consecutive months (3 months in a row) and count the number of such continuous ordering islands.
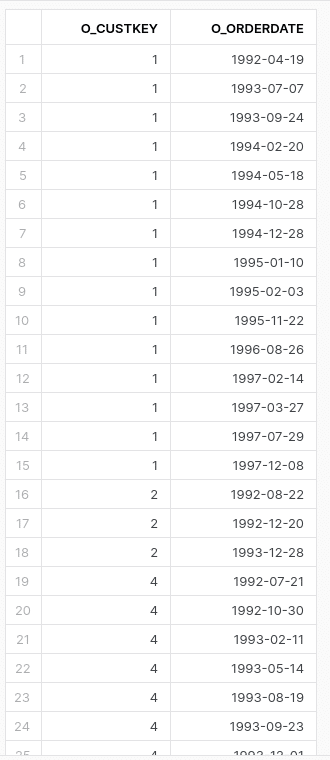
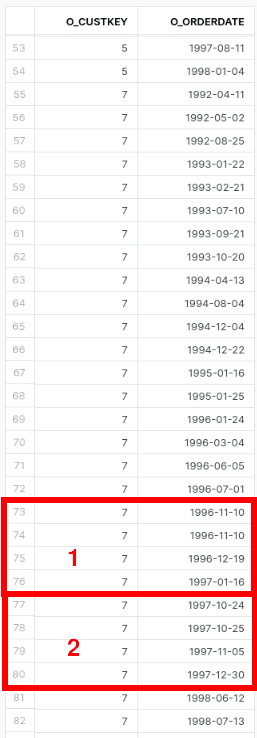
Example
In the figure below we can see two order islands for the customer with o_custkey 7.
Expected Output
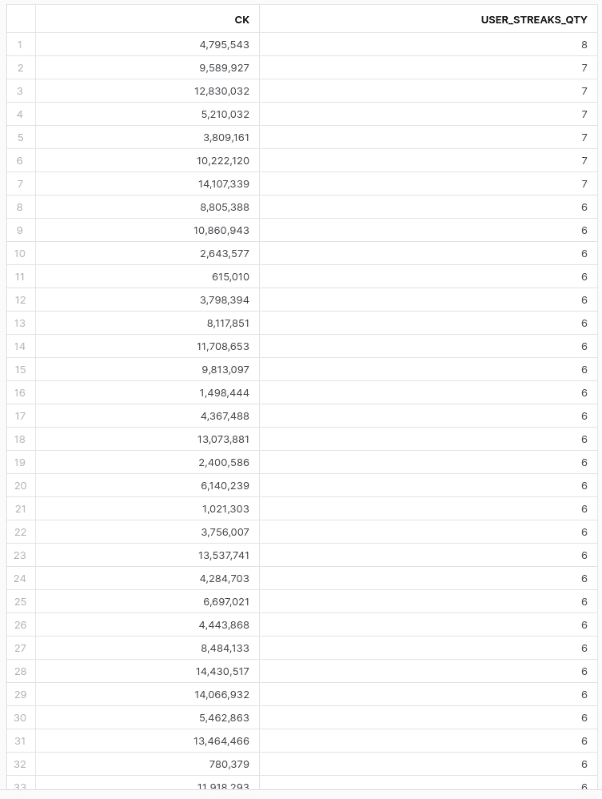
Solution
We have come up with this solution. Try to beat it:
|
1 2 3 4 5 6 7 8 9 10 11 12 13 14 15 16 17 18 19 20 21 22 23 24 25 26 27 28 29 30 31 32 33 34 35 36 37 38 39 40 41 42 43 44 45 46 47 48 49 50 51 52 53 54 55 56 57 58 59 60 |
WITH morders AS( SELECT o_custkey ck ,DATE_TRUNC('MONTH' ,o_orderdate) omth ,COUNT(9) oqty ,LAG(omth)OVER(PARTITION BY ck ORDER BY omth) pm ,DATEDIFF(month ,pm ,omth) dd , CASE 1 WHEN DATEDIFF(month ,pm ,omth) THEN NULL ELSE omth END mth1st FROM ORDERS o GROUP BY ck ,omth ) ,streaks AS( SELECT ck ,omth ,oqty ,mth1st ,pm ,MAX(mth1st)OVER(PARTITION BY ck ORDER BY omth ROWS UNBOUNDED PRECEDING) streak_start_mth FROM morders ) ,streaks2 AS( SELECT ck ,streak_start_mth ,COUNT(9) streak_mth_qty ,SUM(oqty) streak_total_orders FROM streaks GROUP BY ck ,streak_start_mth HAVING streak_mth_qty >= 3 ORDER BY streak_mth_qty DESC ,streak_total_orders DESC ,ck ) SELECT ck ,COUNT(9) user_streaks_qty FROM streaks2 GROUP BY ck ORDER BY user_streaks_qty DESC |
We ran our query 3 times, and these are our results.
|
Run |
Execution time |
VWH size | Cost |
|---|---|---|---|
|
1st |
40s |
XS |
0,088$ |
|
2nd |
40s |
XS |
0,088$ |
|
3rd |
39s |
XS | 0,087$ |
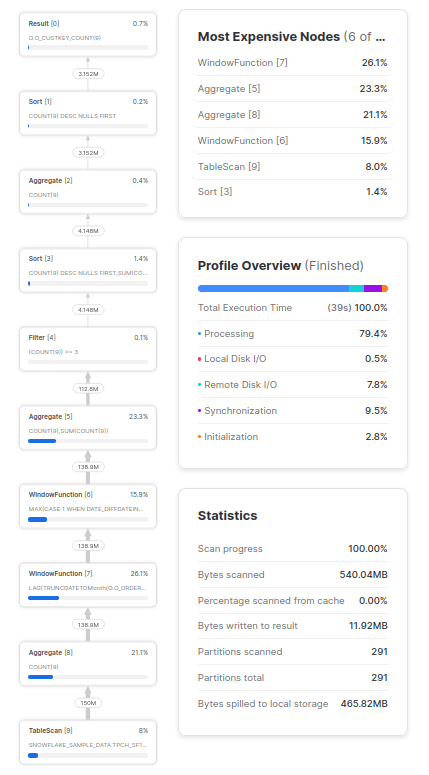
Here is the query profile plan of our best run:
How to submit
- Ensure you have a Snowflake account (register for a free trial, you can check this PDF to see how to register).
- Come up with the correct solution. Try to beat the query cost of the solution we provide.
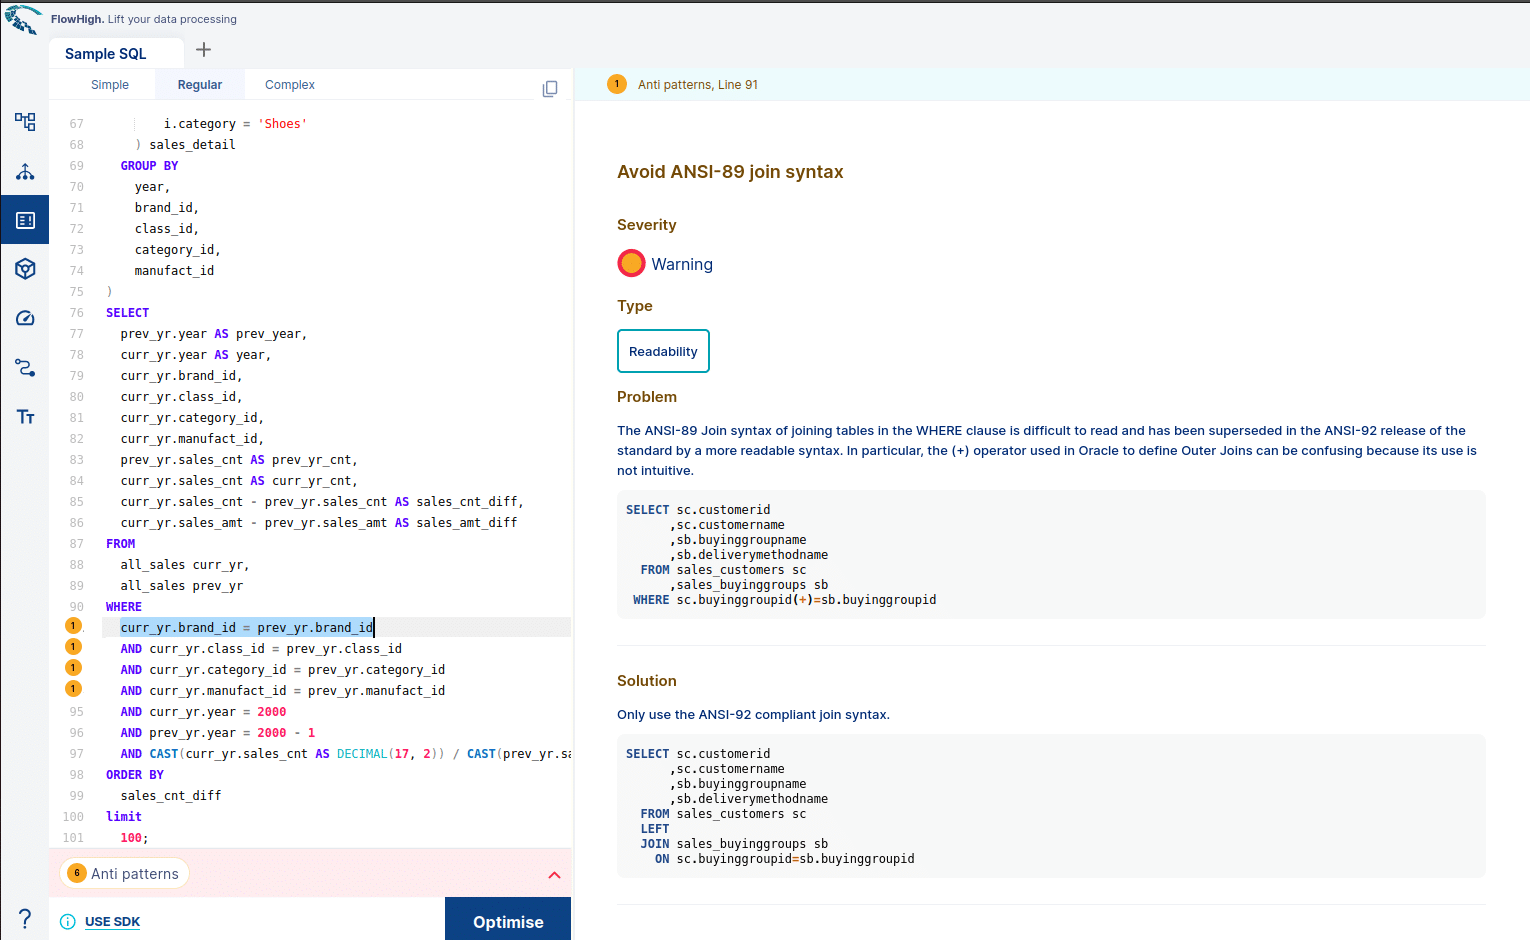
- Before you submit your query register for FlowHigh to check for common SQL antipatterns and coding issues. Bonus: There is a performance anti pattern in the solution we provide. Can you find it with FlowHigh?
Sample screenshot of detecting SQL antipatterns with FlowHigh
- Submit your query through our Google form. Include your name, email, the query, warehouse size you used, and a query profile of your best run as a screenshot.
FAQ
How do you calculate the cost of a query?
Suppose you have a Medium virtual warehouse that consumes 4 credits per hour. Your SQL query ran for 90 seconds, and the cost per credit is $2 (assuming this for the example. Snowflake credits vary by edition and region). For simplicity reasons we ignore the Snowflake minimum billing of 1 minute per query to calculate cost.
- Virtual Warehouse Size: Medium (4 credits/hour)
- Query Execution Time: 90 seconds
- Cost per Credit: $2
First, convert the execution time to hours:
90seconds/3600seconds/hour=0.025 hours
Next, compute the credit consumption:
0.025 hours×4 credits/hour=0.1 credits
Finally, calculate the cost:
0.1 credits×$2/credit=$0.20
So, the cost of the query is $0.20.
Can I add Cluster Keys or Search Optimisation Service?
Yes, you can add cluster keys and secondary indexes (aka SOS) to the table.
You will need to create a copy of the provided sample.
Can I choose the size of the virtual warehouse?
Yes. We compare the query cost of the result and you can choose the size of the virtual warehouse you use.
Any other questions?
Contact us for any issues or questions
Uli Bethke
Uli has been rocking the data world since 2001. As the Co-founder of Sonra, the data liberation company, he’s on a mission to set data free. Uli doesn’t just talk the talk—he writes the books, leads the communities, and takes the stage as a conference speaker.
Any questions or comments for Uli? Connect with him on LinkedIn.
Follow Uli Bethke: