Top Articles

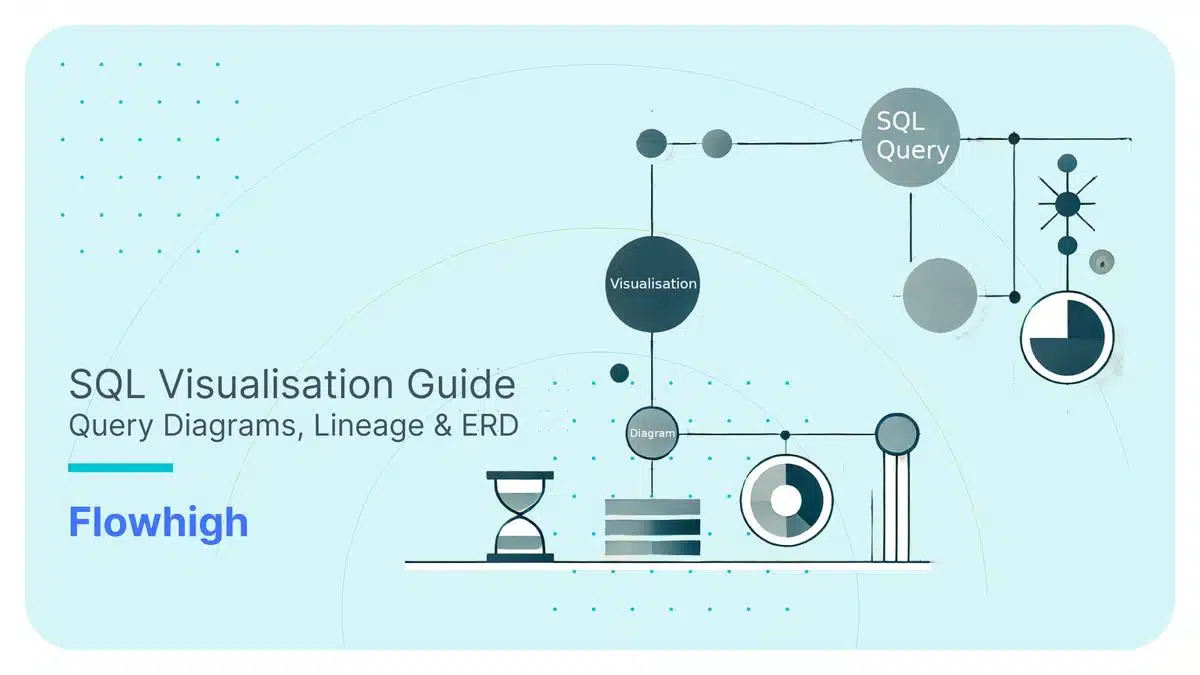
SQL Visualisation Guide – Query Diagrams, Lineage & ERD

Have you ever inherited the SQL codebase from someone else where it is in a “bit of a mess”? 😁 Sound familiar? Most data engineers and SQL developers have been there including myself—staring at a spaghetti-like web of queries, trying to untangle a chaotic SQL codebase. It’s a common nightmare. Traditionally, you had to fight …

Uli Bethke November 3, 2024

Recent Articles

Comparing Snowflake cloud data warehouse to AWS Athena query service.

In this blog post we look at the commonalities and differences between the Snowflake cloud data warehouse and the AWS Athena query service. AWS Athena is built on top of…
Uli Bethke November 27, 2018

The future of ETL and the limitations of data virtualisation and NoETL.

Data has limited value if we don’t transform, integrate, model (either data modelling and building predictive models) or cleanse it. Collecting raw data for no apparent reason or business case…
Uli Bethke October 11, 2018

Sampling in Snowflake. Approximate Query Processing for fast Data Visualisation

Introduction Making decisions can be defined as a process to achieve a desirable result by gathering and comparing all available information.The ideal situation would be to have all the necessary…
Uli Bethke August 2, 2018
SQL,

Converting Financial Information eXchange XML (FIXML) to MS SQL Server

FIX is a messaging standard used for trades in the financial services industry. The FIX Trading Community is the independent body behind the FIX messaging standard. FIX messages are encoded…
Maciek June 5, 2018

Converting and analysing Rugby JSON data to Oracle Data Visualization Desktop

Here is another post that will show how you can work with the output from Flexter to analyse your data. In this post we will show you how to convert…
Uli Bethke May 22, 2018

Exploding polygons in Snowflake. KaBooom! Visualising Dublin property data in Tableau.

Introduction In this blog post we will show the power of Snowflake UDFs to prepare data for visualisation in Tableau. We take the Irish Census Data from the Central Statistics…
Uli Bethke May 14, 2018
spinner