SQL parser for Databricks. Parsing SQL for table audit logging and much more


This is the fifth article in our series on parsing different SQL dialects. We explored SQL parsing on Snowflake, MS SQL Server, Oracle, and Redshift. in our earlier blog posts. We cover SQL parsing on DataBricks in this blog post. We take table and column audit logging as a use case for parsing SQL on Databricks.
We provide practical examples of interpreting SQL from the DataBricks query history. Additionally, we will present some code that utilises the FlowHigh SQL parser SDK to programmatically parse SQL from DataBricks. The parsing of SQL Server SQL can be automated using the SDK.
In another post on the Sonra blog, I go into great depth on the benefits of using an SQL parser. In this post we cover the use cases of an SQL parser for both data engineering and data governance use cases.
One example for a use case of an SQL parser is table and column audit logging. Audit logging refers to the detailed recording of access and operations performed on specific tables and columns in a database including execution of SQL queries. Such logging can be essential for ensuring security, compliance with regulatory standards, and understanding data access patterns.
Use Flexter to turn XML and JSON into Valuable Insights
- 100% Automation
- 0% Coding
SQL parser for Databricks
Sonra has created a powerful online SQL parser designed for any SQL dialect, including DataBricks. It is called FlowHigh. This SaaS platform includes an easy-to-use UI for manual SQL parsing as well as an SDK for managing bulk SQL parsing requirements or automating the operation. We demonstrate FlowHigh’s capabilities by parsing the query history of DataBricks. To programmatically parse the query history, we used the SDK.
Programmatically parsing the DataBricks query history with the FlowHigh SDK
Query history API
Databricks records every SQL query executed and retains this information in the query execution log for a period of 30 days. To retrieve this data, users can utilise a dedicated API endpoint: /api/2.0/sql/history/queries. This endpoint includes details such as the timestamp of execution and the user, among other metrics. You can extract the content of each query via the query_text attribute and also get the query_id as a unique identifier.
Unity Catalog and system tables
Databricks’ API-centric method for accessing the SQL query history is quite different from traditional relational database management systems such as Oracle, MS SQL Server, or other cloud data platforms such as Snowflake.
Databricks recently introduced a new feature called Unity Catalog for storing metadata. It stores metadata but is not very comprehensive in comparison to other platforms such as Snowflake
The Databricks Unity Catalog provides a centralised system to manage and monitor data assets. It offers a consolidated location for all data, ensuring it’s managed under set guidelines. Moreover, it diligently records every action taken on the data within the associated Databricks account, ensuring transparency and accountability.
Databricks currently supports a variety of system tables, each serving a distinct purpose:
- Audit logs: This table captures a record of events and is found at the location system.access.audit.
- Billable usage logs: Used to track billable activities, this table can be accessed at system.billing.usage.
- Pricing table: For insights into pricing details, users can refer to the table at system.billing.list_prices.
- Table and column lineage: Both these tables, which trace the source and flow of data, are housed under the directory system.access.
- Marketplace listing access: This table, which is situated at system.marketplace.listing_access_events, tracks access events related to marketplace
System tables are controlled by Unity Catalog, we must have at least one workspace in our account that is enabled by Unity Catalog in order to enable and access system tables. System tables contain information from every workspace in the account, but only workspaces with the Unity Catalog feature can access them.
FlowForward.
All Things Data Engineering
Straight to Your Inbox!
Programmatically parsing SQL from query history API
The below python code shows how query history is pulled from Databricks and processed using FlowHigh SDK:
|
1 2 3 4 5 6 7 8 9 10 11 12 13 14 15 16 17 18 19 20 21 22 23 24 25 26 27 28 29 30 31 32 33 34 35 36 37 38 39 40 41 42 43 44 45 46 47 48 49 50 51 |
import requests from flowhigh.utils.converter import FlowHighSubmissionClass import pandas as pd def get_databricks_query_history(base_url, token, max_results=100, include_metrics=False): endpoint = f"{base_url}/api/2.0/sql/history/queries" headers = { "Authorization": f"Bearer {token}", "Content-Type": "application/json", } results = [] page_token = None has_next_page = True while has_next_page: params = { "max_results": max_results, "include_metrics": include_metrics, } if page_token: params["page_token"] = page_token response = requests.get(endpoint, headers=headers, params=params) response_data = response.json() if response.status_code != 200: print( f"Error {response.status_code}: {response_data.get('error_code', '')} - {response_data.get('message', '')}") return results results.extend(response_data["res"]) page_token = response_data.get("next_page_token") has_next_page = response_data.get("has_next_page", False) return results data =[] if __name__ == "__main__": BASE_URL = "BASE_URL" TOKEN = "<TOKEN>" query_history = get_databricks_query_history(BASE_URL, TOKEN) for query in query_history: fh = FlowHighSubmissionClass.from_sql(query['query_text']) xml_msg = fh.xml_message entry ={ 'id': query['query_id'],'query':query['query_text'],'xml':xml_msg } data.append(entry) data_df = pd.DataFrame(data) data_df.to_sql(fh_table_name, conn, if_exists='append', index=False) |
Analysing the output of the FlowHigh SQL parser
An SQL query is ingested by the FlowHigh SQL parser for Databricks, which then returns the processed result either as a JSON or XML message. For instance, the parser produces a full JSON message of the SQL query from the query history we collected using the API. This output includes information on the filter conditions, fields fetched, aliases used, join conditions, tables and other components of the SQL statement.
Let’s go through an example
|
1 2 3 4 5 6 7 8 9 10 11 12 13 |
SELECT p_partkey ,p_name ,SUM(l_extendedprice*(1-l_discount)) AS revenue FROM part JOIN lineitem ON p_partkey=l_partkey JOIN orders ON l_orderkey=o_orderkey WHERE p_partkey=456 AND o_orderdate BETWEEN '1994-01-01' AND '1995-01-01' GROUP BY p_partkey ,p_name ORDER BY p_name; |
For illustration, the following is an example SELECT statement output in JSON:
|
1 2 3 4 5 6 7 8 9 10 11 12 13 14 15 16 17 18 19 20 21 22 23 24 25 26 27 28 29 30 31 32 33 34 35 36 37 38 39 40 41 42 43 44 45 46 47 48 49 50 51 52 53 54 55 56 57 58 59 60 61 62 63 64 65 66 67 68 69 70 71 72 73 74 75 76 77 78 79 80 81 82 83 84 85 86 87 88 89 90 91 92 93 94 95 96 97 98 99 100 101 102 103 104 105 106 107 108 109 110 111 112 113 114 115 116 117 118 119 120 121 122 123 124 125 126 127 128 129 130 131 132 133 134 135 136 137 138 139 140 141 142 143 144 145 146 147 148 149 150 151 152 153 154 155 156 157 158 159 160 161 162 163 164 165 166 167 168 169 170 171 172 173 174 175 176 177 178 179 180 181 182 183 184 185 186 187 188 189 190 191 192 193 194 195 196 197 198 199 200 201 202 203 204 205 206 207 208 209 210 211 212 213 214 215 216 217 218 219 220 221 222 223 224 225 226 |
{ "0": { "pos": "0-320", "ds": [ { "pos": "0-320", "type": "root", "subType": "inline", "out": { "exprs": [ { "pos": "7-11", "oref": "C1", "eltype": "attr" }, { "pos": "24-8", "oref": "C2", "eltype": "attr" }, { "type": "fagg", "pos": "39-46", "alias": "revenue", "name": "SUM", "exprs": [ { "pos": "43-30", "exprs": [ { "pos": "43-15", "oref": "C3", "eltype": "attr" }, { "pos": "60-12", "exprs": [ { "value": 1, "eltype": "const" }, { "pos": "62-10", "oref": "C4", "eltype": "attr" } ], "type": "PLUS", "eltype": "op" } ], "type": "MULTI", "eltype": "op" } ], "eltype": "func" } ], "eltype": "out" }, "in": { "exprs": [ { "pos": "91-6", "alias": "p", "oref": "T1", "eltype": "ds" }, { "type": "inner", "definedAs": "explicit", "ds": { "pos": "103-10", "alias": "l", "oref": "T2", "eltype": "ds" }, "op": { "pos": "119-23", "exprs": [ { "pos": "119-11", "oref": "C1", "eltype": "attr" }, { "pos": "131-11", "oref": "C5", "eltype": "attr" } ], "type": "EQ", "eltype": "op" }, "eltype": "join" }, { "type": "inner", "definedAs": "explicit", "ds": { "pos": "148-8", "alias": "o", "oref": "T3", "eltype": "ds" }, "op": { "pos": "162-25", "exprs": [ { "pos": "162-12", "oref": "C6", "eltype": "attr" }, { "pos": "175-12", "oref": "C7", "eltype": "attr" } ], "type": "EQ", "eltype": "op" }, "eltype": "join" } ], "eltype": "in" }, "modifiers": [ { "type": "filtreg", "op": { "pos": "194-73", "exprs": [ { "pos": "194-15", "exprs": [ { "pos": "194-11", "oref": "C1", "eltype": "attr" }, { "value": 456, "eltype": "const" } ], "type": "EQ", "eltype": "op" }, { "pos": "215-52", "exprs": [ { "pos": "215-13", "oref": "C8", "eltype": "attr" }, { "value": "'1994-01-01'", "eltype": "const" }, { "value": "'1995-01-01'", "eltype": "const" } ], "type": "BETWEEN", "eltype": "op" } ], "type": "AND", "eltype": "op" }, "eltype": "filter" }, { "type": "aggreg", "exprs": [ { "pos": "277-11", "oref": "C1", "eltype": "attr" }, { "pos": "294-8", "oref": "C2", "eltype": "attr" } ], "eltype": "agg" }, { "exprs": [ { "pos": "312-8", "direction": "asc", "oref": "C2", "eltype": "attr" } ], "eltype": "sort" } ], "eltype": "ds" } ], "antiPatterns": [ { "type": "AP_11", "pos": [ "43-15", "62-10" ], "eltype": "antiPattern" }, { "type": "AP_08", "pos": [ "39-46" ], "eltype": "antiPattern" } ], "eltype": "statement" } } |
Tables and columns
In the JSON representation, datasets are denoted as T1, T2, and T3, which are likely references or aliases for the tables used in the SQL query. Columns in the statement are labelled as C1, C2, C3, and C4. If a particular column has an alias, it is provided within the JSON. In cases where there’s no alias, the column is simply represented by its label, such as C1, C2, etc.
Joins
The analysis of the JSON representation reveals two inner join conditions. The initial join condition establishes a connection based on the attributes C1 and C5. Meanwhile, the subsequent join condition associates the attributes C6 and C7.
|
1 2 3 4 5 6 7 8 9 10 11 12 13 14 15 16 17 18 19 20 21 22 23 24 25 26 27 28 29 30 31 32 33 34 |
{ "type": "inner", "op": { "exprs": [ { "oref": "C1", "eltype": "attr" }, { "oref": "C5", "eltype": "attr" } ], "type": "EQ", "eltype": "op" } }, { "type": "inner", "op": { "exprs": [ { "oref": "C6", "eltype": "attr" }, { "oref": "C7", "eltype": "attr" } ], "type": "EQ", "eltype": "op" } } |
GROUP BY
The JSON shows that the data is grouped using two columns: C1 and C2.
|
1 2 3 4 5 6 7 8 9 10 11 12 13 14 |
{ "type": "aggreg", "exprs": [ { "oref": "C1", "eltype": "attr" }, { "oref": "C2", "eltype": "attr" } ], "eltype": "agg" } |
FILTER
From the JSON data, it’s evident that the query uses certain filter conditions. Specifically, it selects entries where the column C1 matches a value of 456. It also filters the data to rows where the column C8 has dates ranging from ‘1994-01-01’ to ‘1995-01-01’. These criteria ensure that only pertinent records fitting these parameters are chosen.
|
1 2 3 4 5 6 7 8 9 10 11 12 13 14 15 16 17 18 19 20 21 22 23 24 25 26 27 28 29 30 31 32 33 34 35 |
{ "type": "filtreg", "op": { "exprs": [ { "pos": "175-13", "exprs": [ { "oref": "C1" }, { "value": 456 } ], "type": "EQ" }, { "pos": "194-50", "exprs": [ { "oref": "C8" }, { "value": "'1994-01-01'" }, { "value": "'1995-01-01'" } ], "type": "BETWEEN" } ], "type": "AND" } } |
ORDER BY
From the JSON data, we see that the query sorts its results using the ORDER BY clause in ascending order on column C2.
|
1 2 3 4 5 6 7 8 9 10 11 |
{ "exprs": [ { "pos": "285-6", "direction": "asc", "oref": "C2", "eltype": "attr" } ], "eltype": "sort" } |
FlowHigh User Interface for SQL parsing
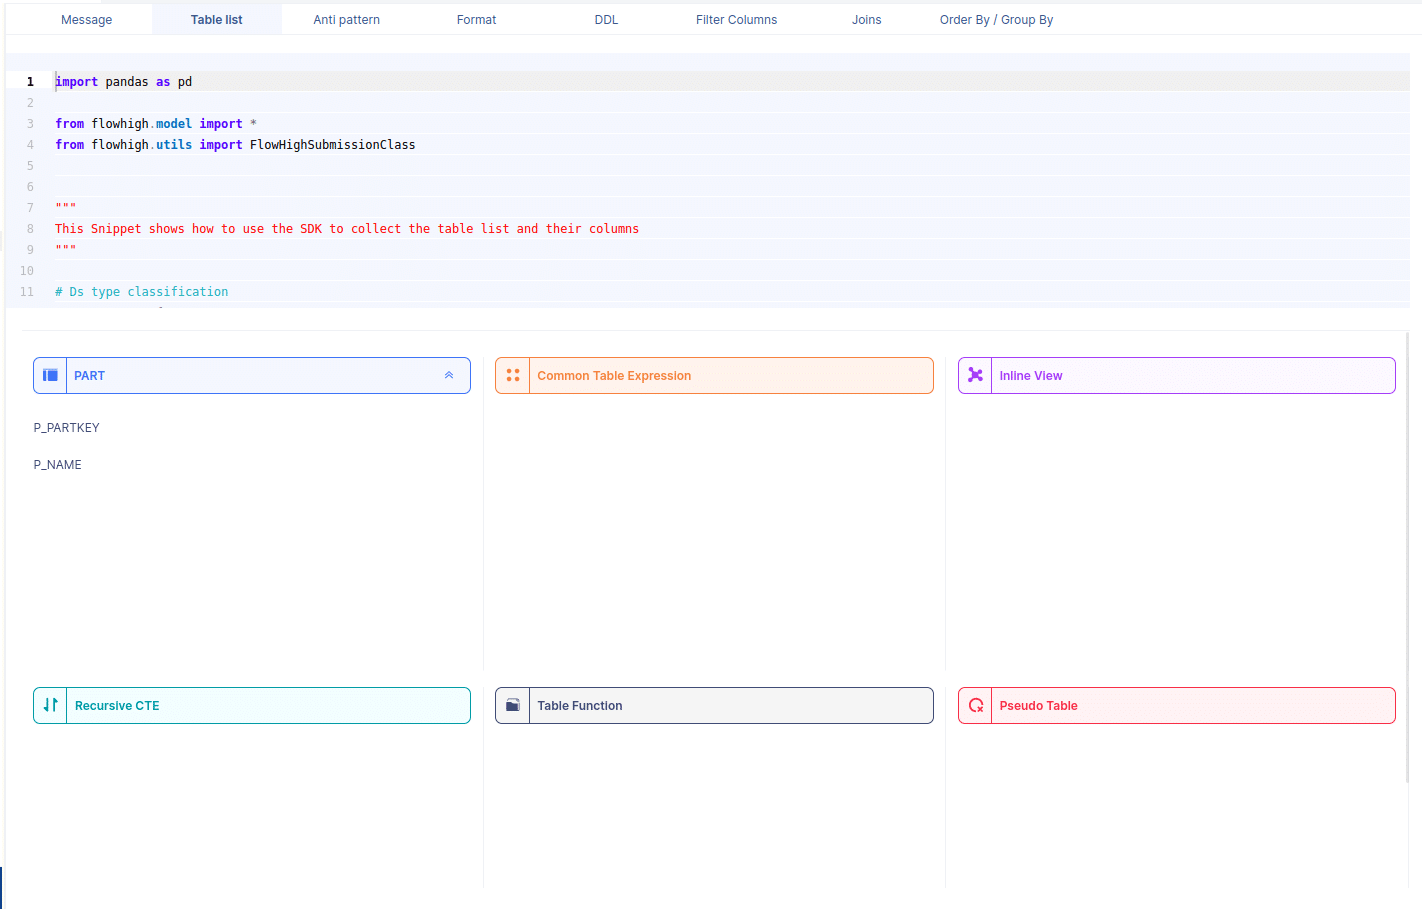
You can also access the FlowHigh SQL parser through the web based user interface. The below figure shows how FlowHigh provides the information about tables in a SQL query by grouping them into types of tables.
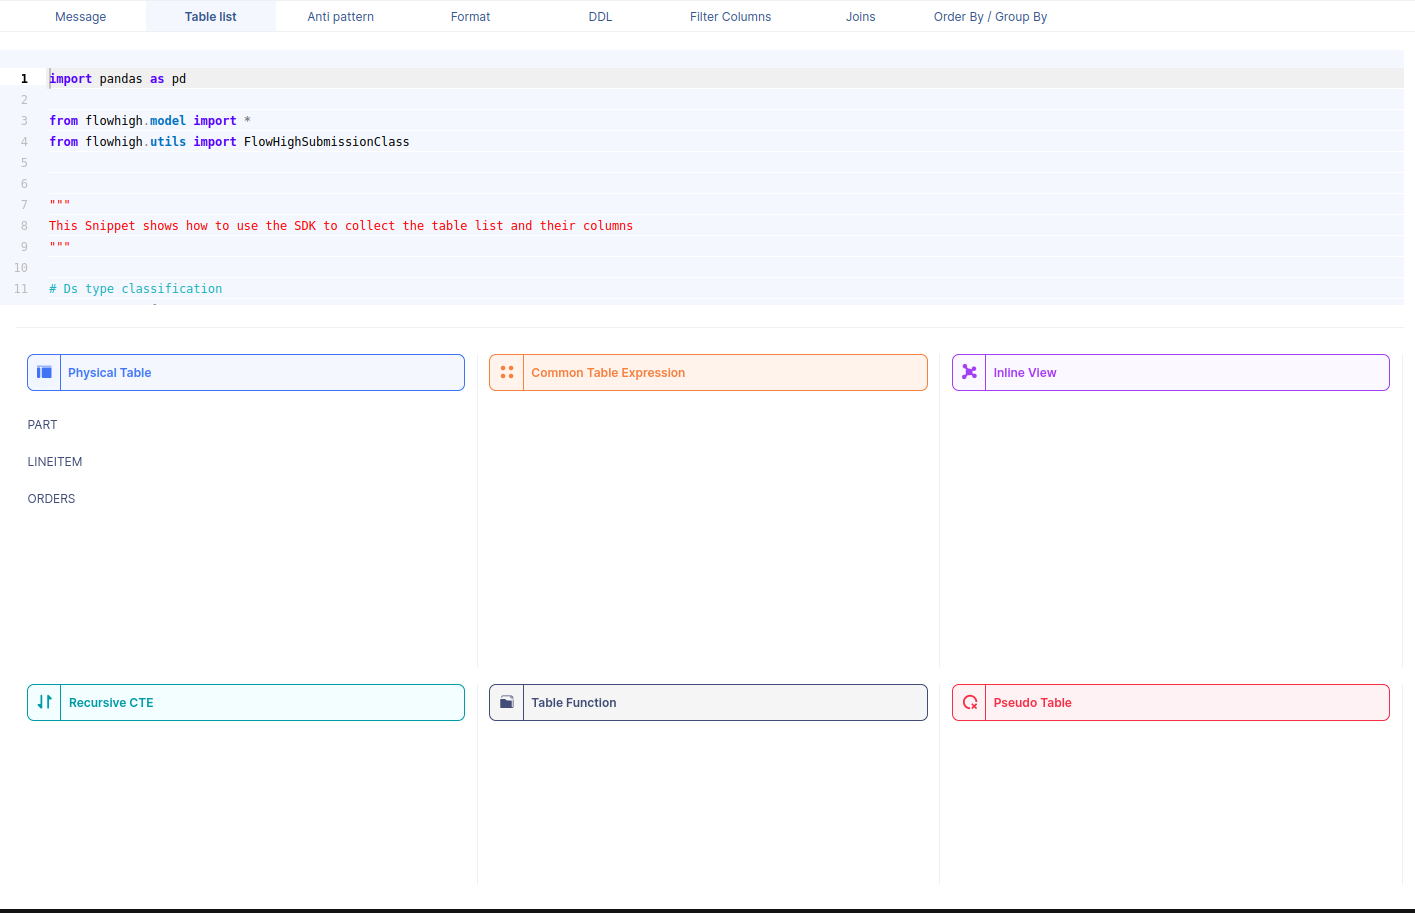
When we select a table name, it reveals the associated column names. For instance, by selecting the PART table, we can view its corresponding column names.
Likewise FlowHigh can be used to get columns used in a where conditions ,order by m group by and joins in the SQL query.
Columns used in GROUP BY / ORDER BY clause
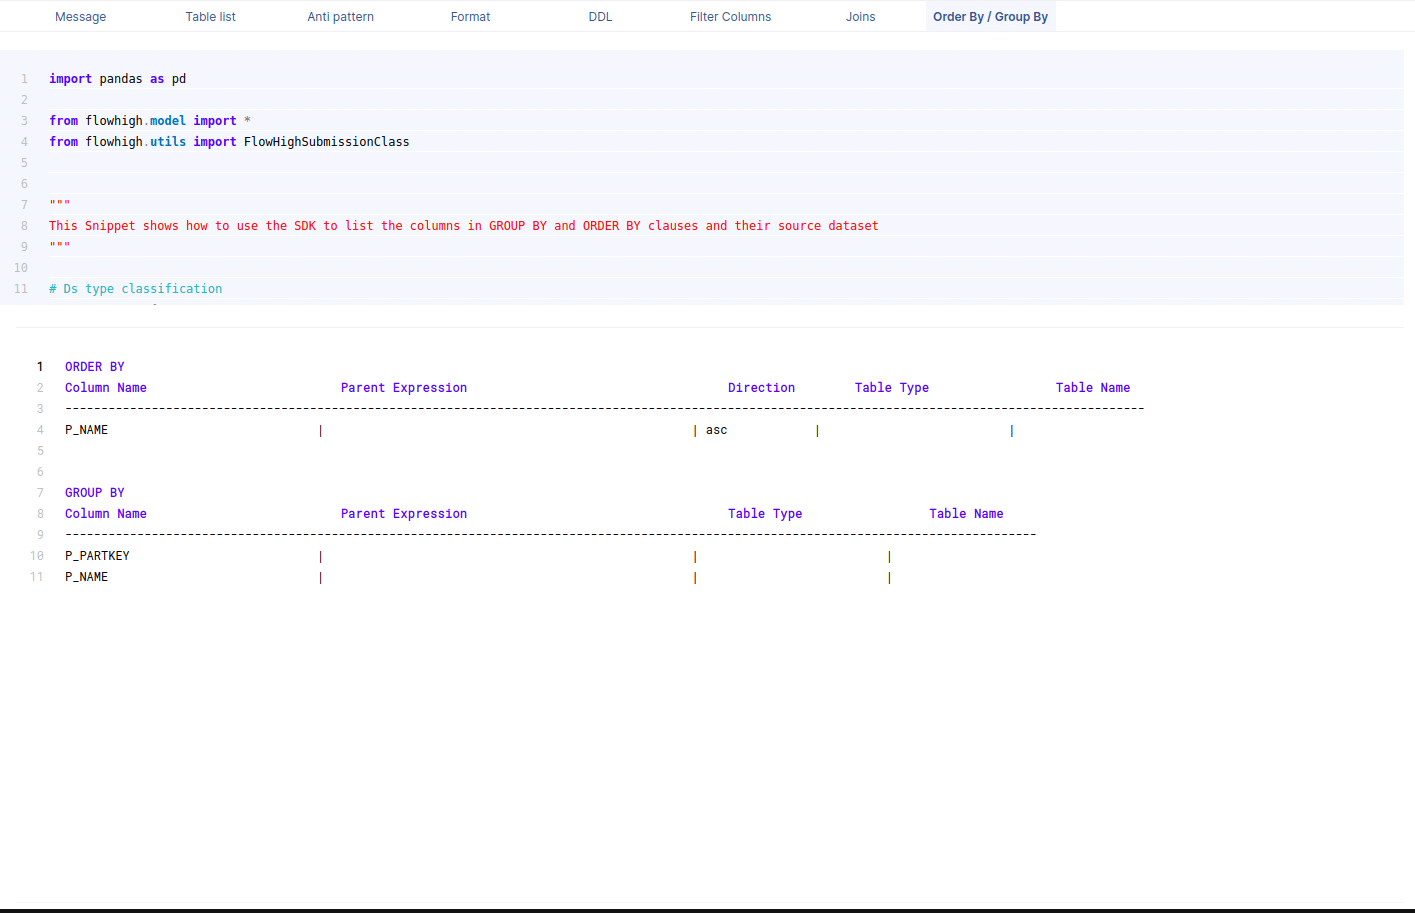
This figure shows how FlowHigh can be used to filter out the columns used in order by and group by clause.
Filter columns
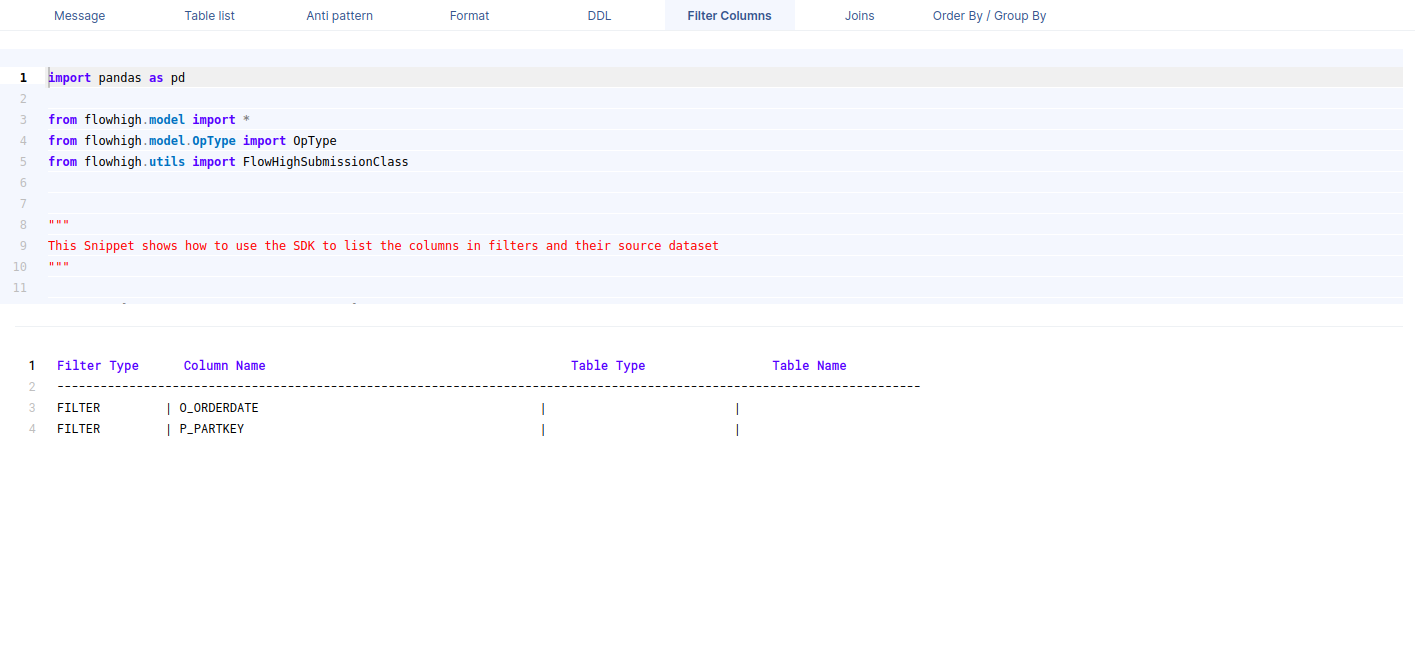
This figure shows how FlowHigh can be used to filter out the columns used in where clauses.
Columns in join conditions
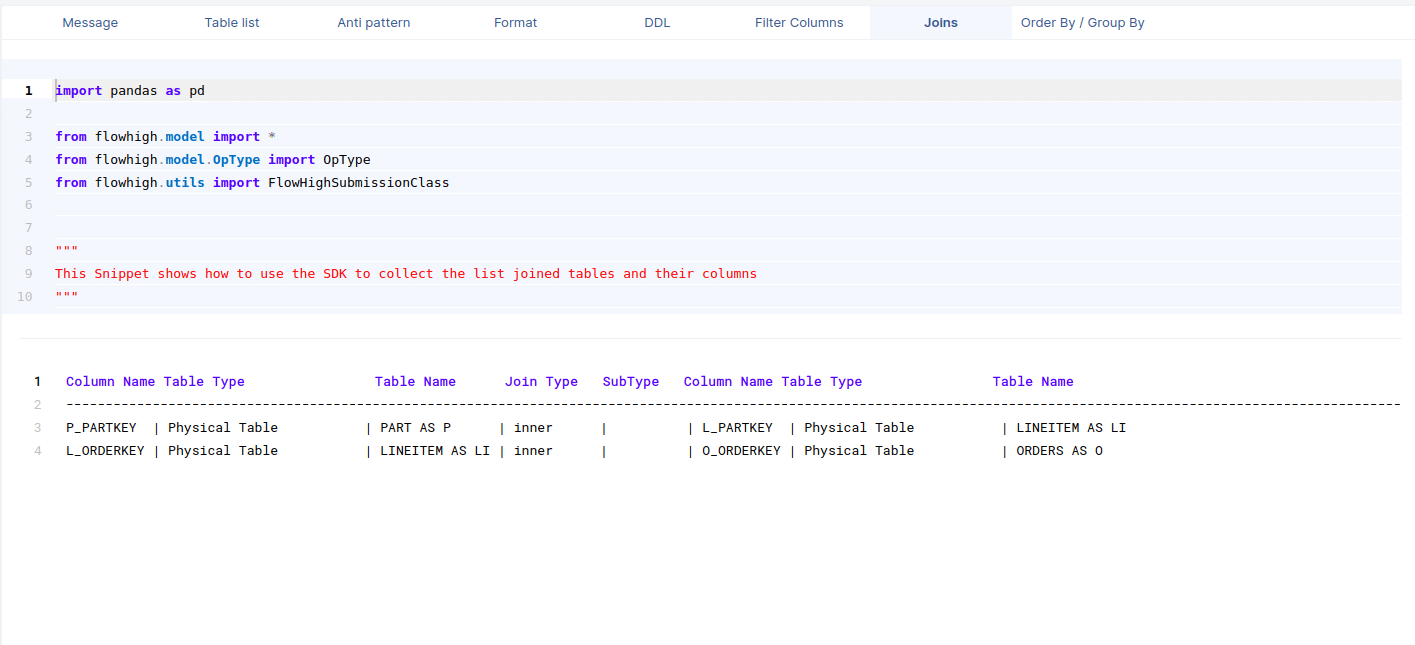
This figure shows how FlowHigh can be used to filter out the columns used and type of join.
Need more?
FlowHigh ships with two other modules
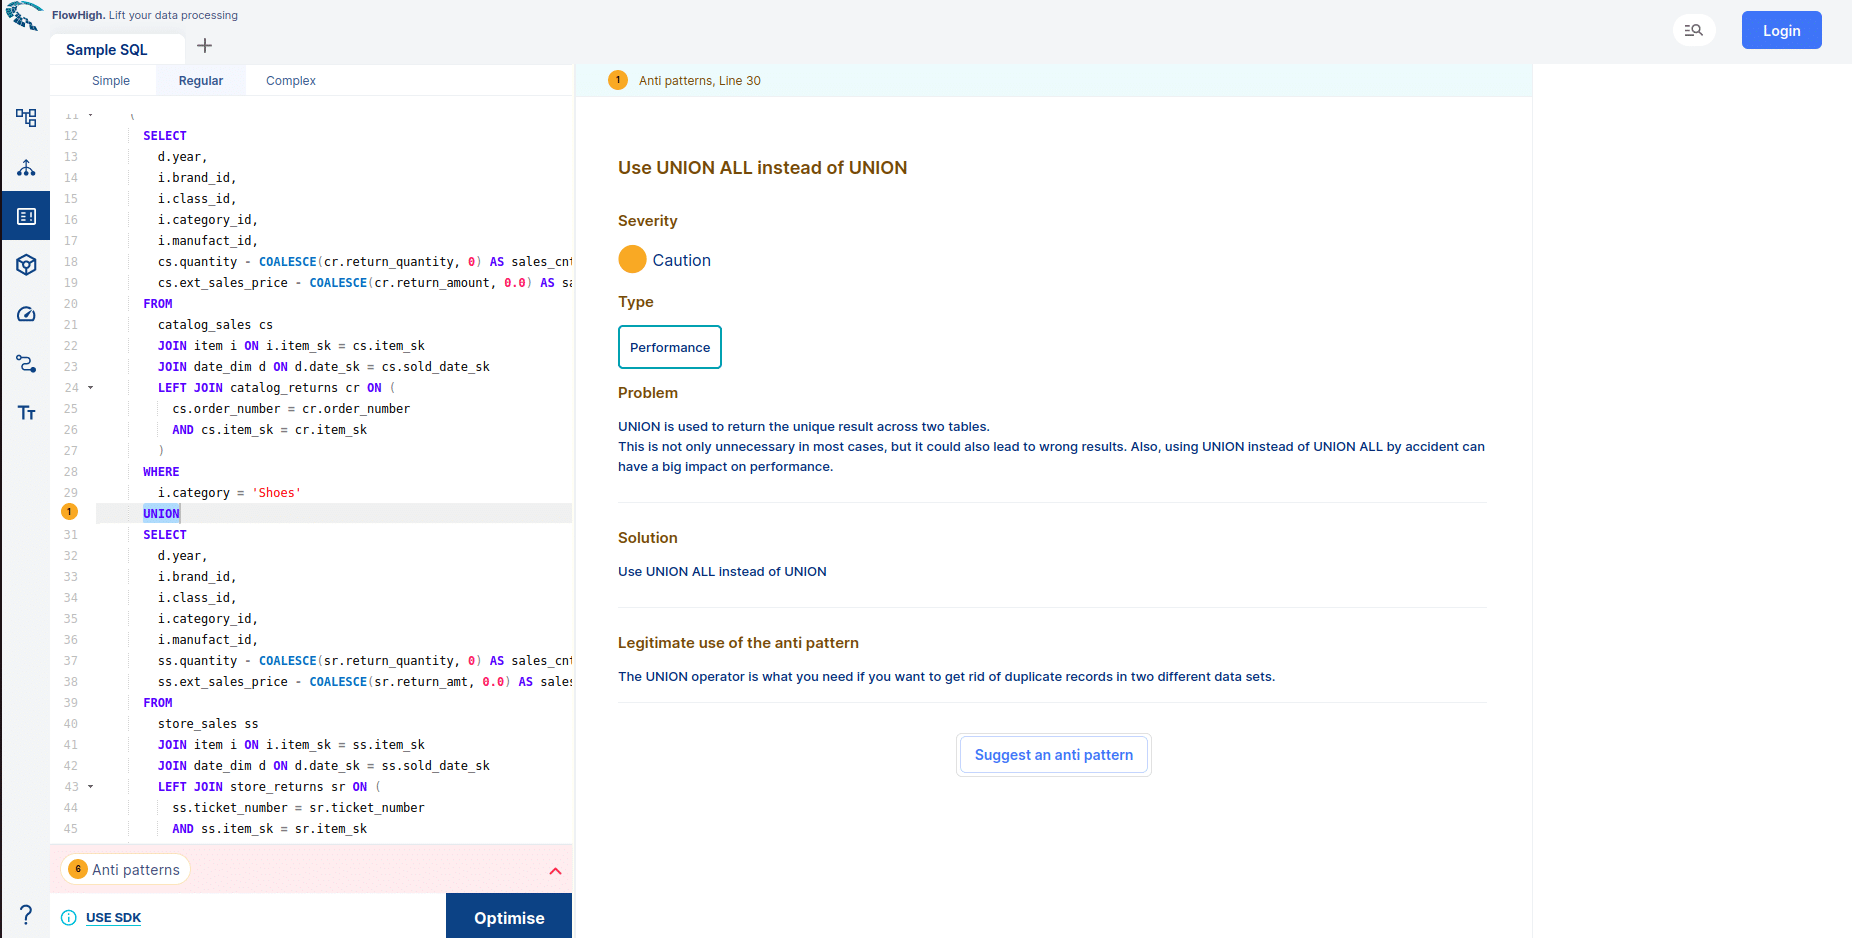
- FlowHigh SQL Analyser. The Analyser checks for issues in your SQL code. It detects 30+ anti patterns in SQL code
I have written up a blog post on automatically detecting bad SQL code.
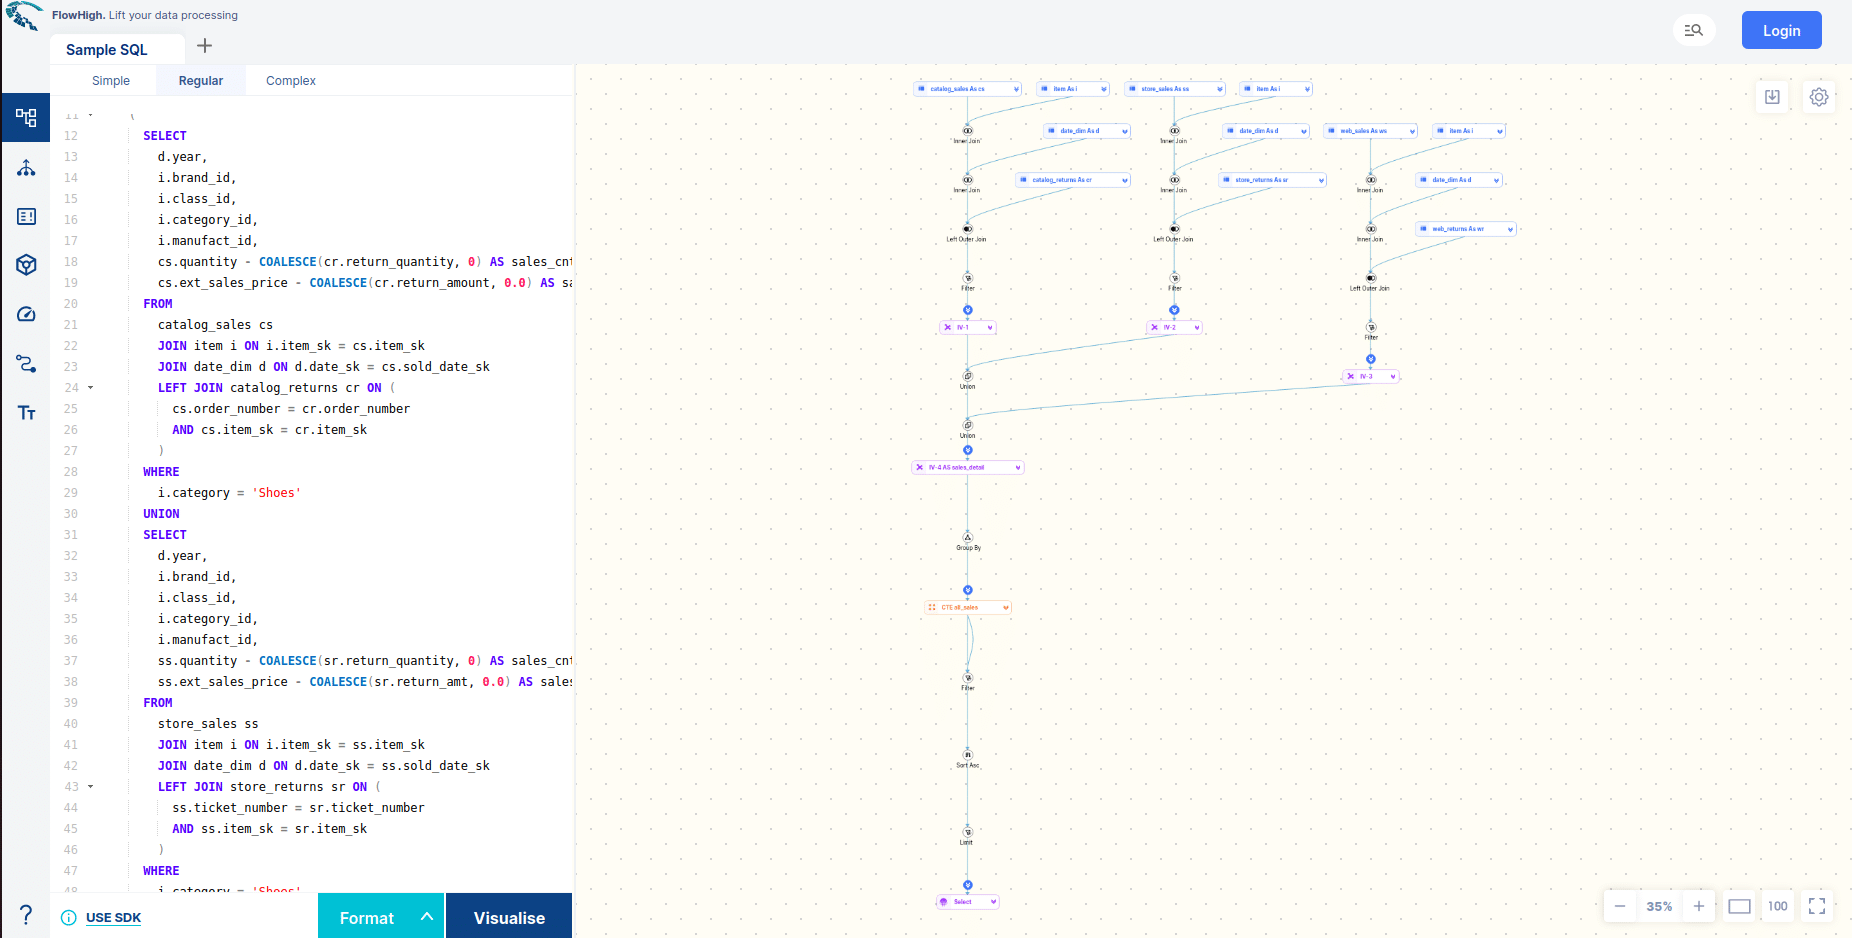
- FlowHigh SQL Visualiser. Visualising SQL queries helps understand complex queries. It lets developers see how each part of the query contributes to the final result, making it easier to understand and debug.
Do you want to dive hands-on into SQL parsing? Request access to the FlowHigh to parse Databricks SQL.
Uli Bethke
Uli has been rocking the data world since 2001. As the Co-founder of Sonra, the data liberation company, he’s on a mission to set data free. Uli doesn’t just talk the talk—he writes the books, leads the communities, and takes the stage as a conference speaker.
Any questions or comments for Uli? Connect with him on LinkedIn.
Follow Uli Bethke: