Converting and analysing Rugby JSON data to Oracle Data Visualization Desktop

Here is another post that will show how you can work with the output from Flexter to analyse your data. In this post we will show you how to convert complex JSON files to Oracle Data Visualization Desktop.
Use Flexter to turn XML and JSON into Valuable Insights
- 100% Automation
- 0% Coding
Oracle Data Visualization Desktop
Oracle Data Visualization Desktop is a competing product to Tableau and PowerBI. It makes it easy to visualize and analyse your data.
Processing JSON file
We will be processing JSON file with information about some of the best Rugby players, and will show you which ones are the heaviest comparing to their height. For this demonstration we will be using the Docker version of Enterprise Flexter. Get in touch if you would like to try out the Flexter Docker version.
- In a first step we start Enterprise Flexter
|
1 |
$docker run --rm -it -v c:/users/your_user:/mnt/data d1.sonra.io:5000/flexter-local |
- Next we generate the Locigal Schema ID
|
1 |
$json2er -g1 /mnt/data/Desktop/rugby.json |
The result will be similar to below:
|
1 2 3 4 5 6 7 8 9 10 |
# schema origin: 2 logical: 1 job: 1 # statistics startup: 8074 ms parse: 13496 ms stats: 1474 ms map: 802 ms xpaths: 441 |
- Next we convert the JSON data to CSV files
|
1 |
$json2er -l<logical schema ID> -o /mnt/data/Desktop/rugby -f csv -S o /mnt/data/Desktop/rugby.json |
The result will be similar to below:
|
1 2 3 4 5 6 7 8 9 10 11 12 13 14 15 16 17 |
22:48:51.012 INFO calculating statistics 22:48:52.703 INFO writing statistics 22:48:52.744 INFO table du_stat: writing 22:48:53.374 INFO updating schema origin 2 22:48:53.376 INFO Registering success of job 2 22:48:53.395 INFO Finished successfully in 41234 milliseconds # schema origin: 2 logical: 1 job: 2 # statistics startup: 5958 ms load: 350 ms parse: 5164 ms write: 27384 ms stats: 2362 ms xpaths: 441 |
[flexter_button]
Visualizing data
Next we analyze and visualise the converted JSON data. We start Oracle Data Visualization Desktop, and select to Create a Project.

- We select “Create Data Set”
- Then we chose to upload the file
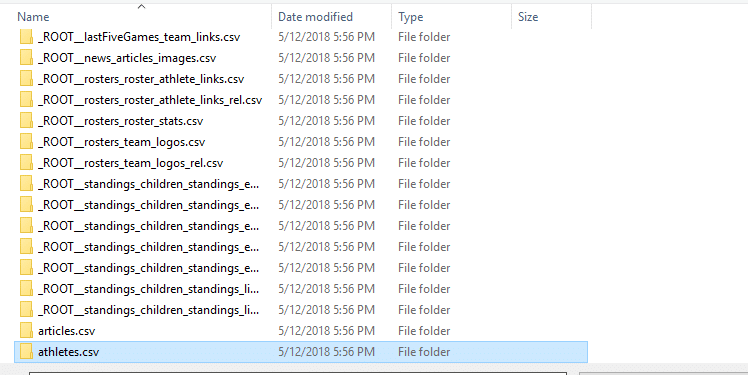
- Next we go to our output dir, and select to upload csv file from athletes folder
- When data is uploaded, we select “Add” button at top right corner
- Then we drag and drop the data elements around
- And we are done. We can see our data in nice line visualization
Wow that Thomas Francis is a big guy.
Conclusion
In this post, we have shown you to convert complex JSON to CSV and then analyze the CSV files with Oracle Visualisation Desktop.
If you are interested in Enterprise Flexter feel free to contact us.
Uli Bethke
Uli has been rocking the data world since 2001. As the Co-founder of Sonra, the data liberation company, he’s on a mission to set data free. Uli doesn’t just talk the talk—he writes the books, leads the communities, and takes the stage as a conference speaker.
Any questions or comments for Uli? Connect with him on LinkedIn.
Follow Uli Bethke: