Location analytics and geospatial data on Snowflake

Use Flexter to turn XML and JSON into Valuable Insights
- 100% Automation
- 0% Coding
What is Geospatial / GIS data?
Geospatial data and location analytics
Geospatial Data can be defined as data with a geographic component, e.g. Address, ZipCode, latitude / longitude etc. These components help us to understand the location of the object, phenomenon or event, e.g. the location of a mall, the property prices in a particular area, the changing location of a moving vehicle etc.
Transactional data most of the time has a geographical component, e.g. postal code, state name, country name etc. This data, when merged with geospatial data, can provide valuable insights. This method of combining and analyzing transactional data with geospatial data is called location analytics. This can be done in real time analysis or as a historical analysis. Lets see how location analytics improves and complements traditional methods of analysis and how it can help save time and resources for your organisation.
Real Time location analytics
It can be used in courier services, postal services, military services etc.
Let’s say you have an online commerce company and you have to deliver a parcel to a location.
Without Geospatial data: You take the parcel and according to your knowledge take the best route to deliver the parcel.
If everything goes well your parcel will be delivered on time. But what if the road is blocked due to an accident or some construction work. This may lead to wastage of time and due to this many deliveries will be delayed.
With Geospatial data: If real time location data is added to the day to day delivery we can see that the best route which we will be taking is blocked and thus can reroute the path and deliver the product on time.
Historical location analytics
Let’s say you are a retail giant and want to open physical stores and are searching for a good location for your stores.
Without geospatial data: You query your transactional data and group it by the location parameter and then see the top 10-20 areas which have higher sales.
With geospatial data: When you combine your transaction data with geospatial data you can see the heatmap of all the areas at once and identify a location which is in between areas which have high sales. This can also help you identify areas which have low sales and many insights can be drawn from just one heatmap.
Other examples for the location analytics:
A property website could enrich the location data of the property with other data sets.
Integrating map data, the property website can query the number of properties within 500 metres of a coastline (risk of flooding).
Integrating location, data the property website can query the number of shops, amenities, and creches within walking distance of a property.
Geographic Information System (GIS)
GIS systems are used to store geographic information and integrate it with software programs so that spatial information can be created, analyzed, manipulated, visualized etc.
The concept of GIS came into the picture in the early 1960’s. At the time there was no system which could analyze map data. One of the first use cases was about land usage in Canada.
By the 1990’s many companies adopted the technology and developed software solutions for analyzing geographical data. A company named ESRI came up with ArcView now referred to as ArcGIS for Desktop Basic, a desktop solution for mapping systems.
Geospatial in relational databases
The first relational databases did not have support for geospatial data. Location analytics was just not a focus for relational databases initially. However, as relational databases are a great tool to query vast amounts of event and transaction data, support for geodata was gradually added to databases.
Let’s look at a use case. We want to store boundary information of a country in a relational database.
Boundaries are made up of thousands of geopoints. These contain the latitude and longitude of each point along with the index for the order. Without a dedicated geo data type it would be tricky to query this information or to use it to find geopoints inside the boundary.
In a database with geospatial support, we create a geofield to store geography data. We then merge all the 10,000 points into one geo point and store this data in a single row.
PostGIS is a very popular geospatial module that adds support for geographical objects to the PostgreSQL relational database. The first stable version of PostGIS was released in 2005. It is an open source database and is very powerful when it comes to geospatial functions.
Geospatial data on Snowflake
Support for geospatial data was added to the Snowflake data platform earlier this year. The geospatial module is currently in public preview. One key advantage of Snowflake over other geospatial databases, e.g. PostGIS is that the workload can be distributed across multiple servers and clusters. As a result, Snowflake can handle large volumes of geospatial data.
Snowflake supports various geo data types and various geo functions. Let’s have a closer look at them.
Geo data types
Geographic data can be divided into three types: point, line and polygon.
Points are zero dimensional data that can be used to mark a specific location. For example, the location of a shop.
Lines are one dimensional data that can be used to represent linear features. For example, the location of a road.
Polygons are two dimensional data that can be used to represent boundaries or areas. For example, location of a shopping mall, location of a county etc.
When we combine multiple geo types into one, we call it a collection. A collection of multiple points is called a MultiPoint, collection of multiple lines is called a MultiLineString, a collection of multiple polygons is called a MultiPolygon and a collection of multiple geometry objects is called a GeometryCollection.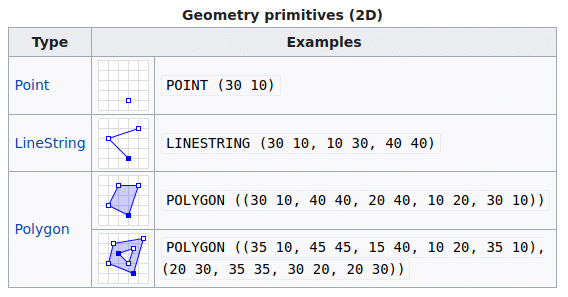
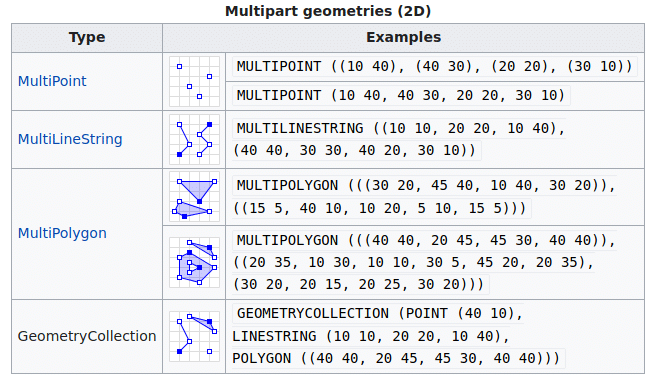
The above two figures show the geo data types in WKT format. To read more about this, visit the following link, WKT Representation of Geometry.
Geo functions
Geo Functions help us operate on columns with geo values. Values might be stored in text and thus before performing geo operations we need to convert it to a geo data type.
Functions like TO_GEOGRAPHY, TRY_TO_GEOGRAPHY, ST_POINT etc. are used to convert valid data to a geography data type.
Functions like ST_COLLECT can be used to create collections of geography objects. We can use ST_COLLECT to create a multipolygon which can be used to represent holes in a polygon; or we can create a way which can be a collection of many line strings.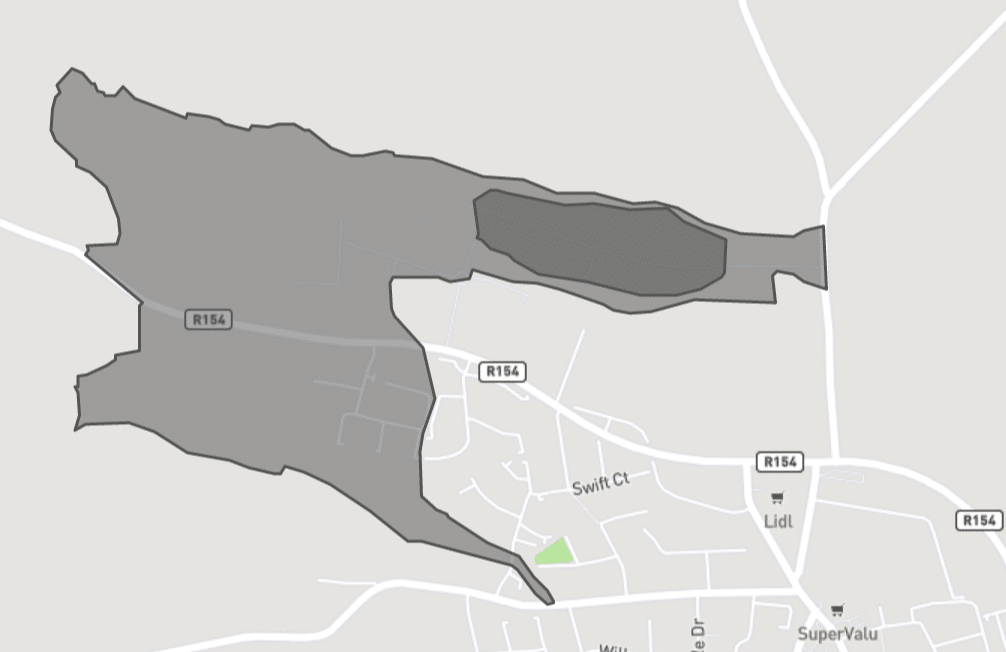
The above figure is created from a multipolygon object. It consists of two polygons, inner and outer.
Other functions are very useful for analyzing data, e.g. ST_INTERSECTS, ST_DWITHIN, ST_COVERS, ST_PERIMETER etc. Some of the examples are,
What is the distance between shop A and Shop B? (ST_DISTANCE)
How many shops are there in an area? (ST_COVERS)
How many supermarkets are there in a radius of 500? (ST_DWITHIN)
Which streets go through an area? (ST_INTERSECTS)
What is the perimeter of a shopping mall in meters? (ST_PERIMETER)
What is the length of a river? (ST_LENGTH)
What is the centre point of a big area? (ST_CENTROID)
What is the latitude and longitude of all the centre points? ST_X (LON) and ST_Y (LAT)
Working with geospatial data in Snowflake
We will now go through various examples and show you some Snowflake geo functions in action. We will use property data from London as our transactional data and enrich it with UK OpenStreetMap data and UK boundaries data from the data marketplace.
Property data
The data is for residential properties in London.
The data contains ID, Name, Bed Specification, Price, Latitude,Longitude and Coordinates(Geography Data Type).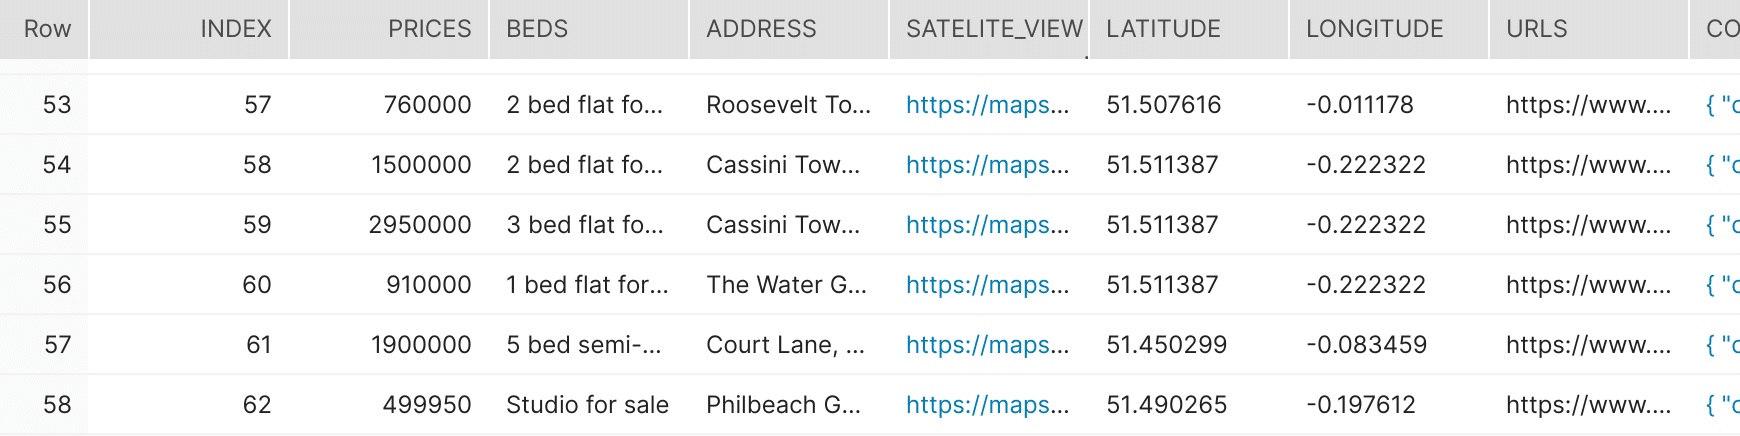
Datamarketplace
We will subscribe to Sonra’s OpenStreetMap and UK admin boundary data from the Snowflake data marketplace.
Steps to subscribe to OSM and Boundary data
1. Select Data Marketplace in the menu and click on Explore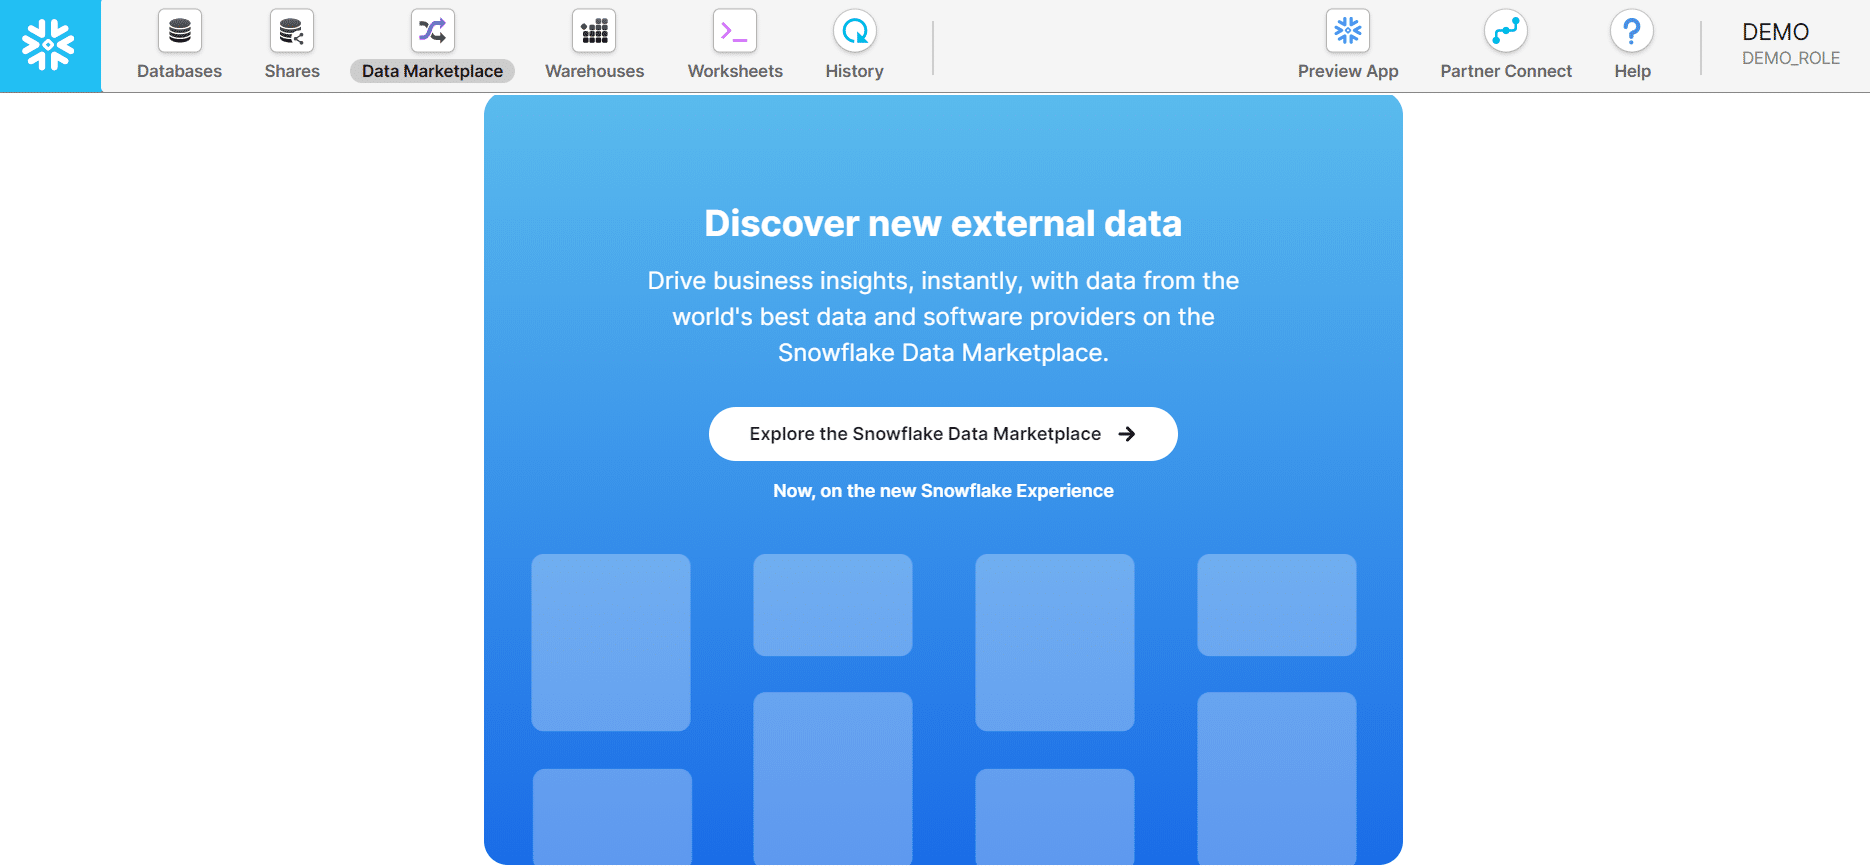
2. Sign in to continue
3. Go to Local and you can find all three datasets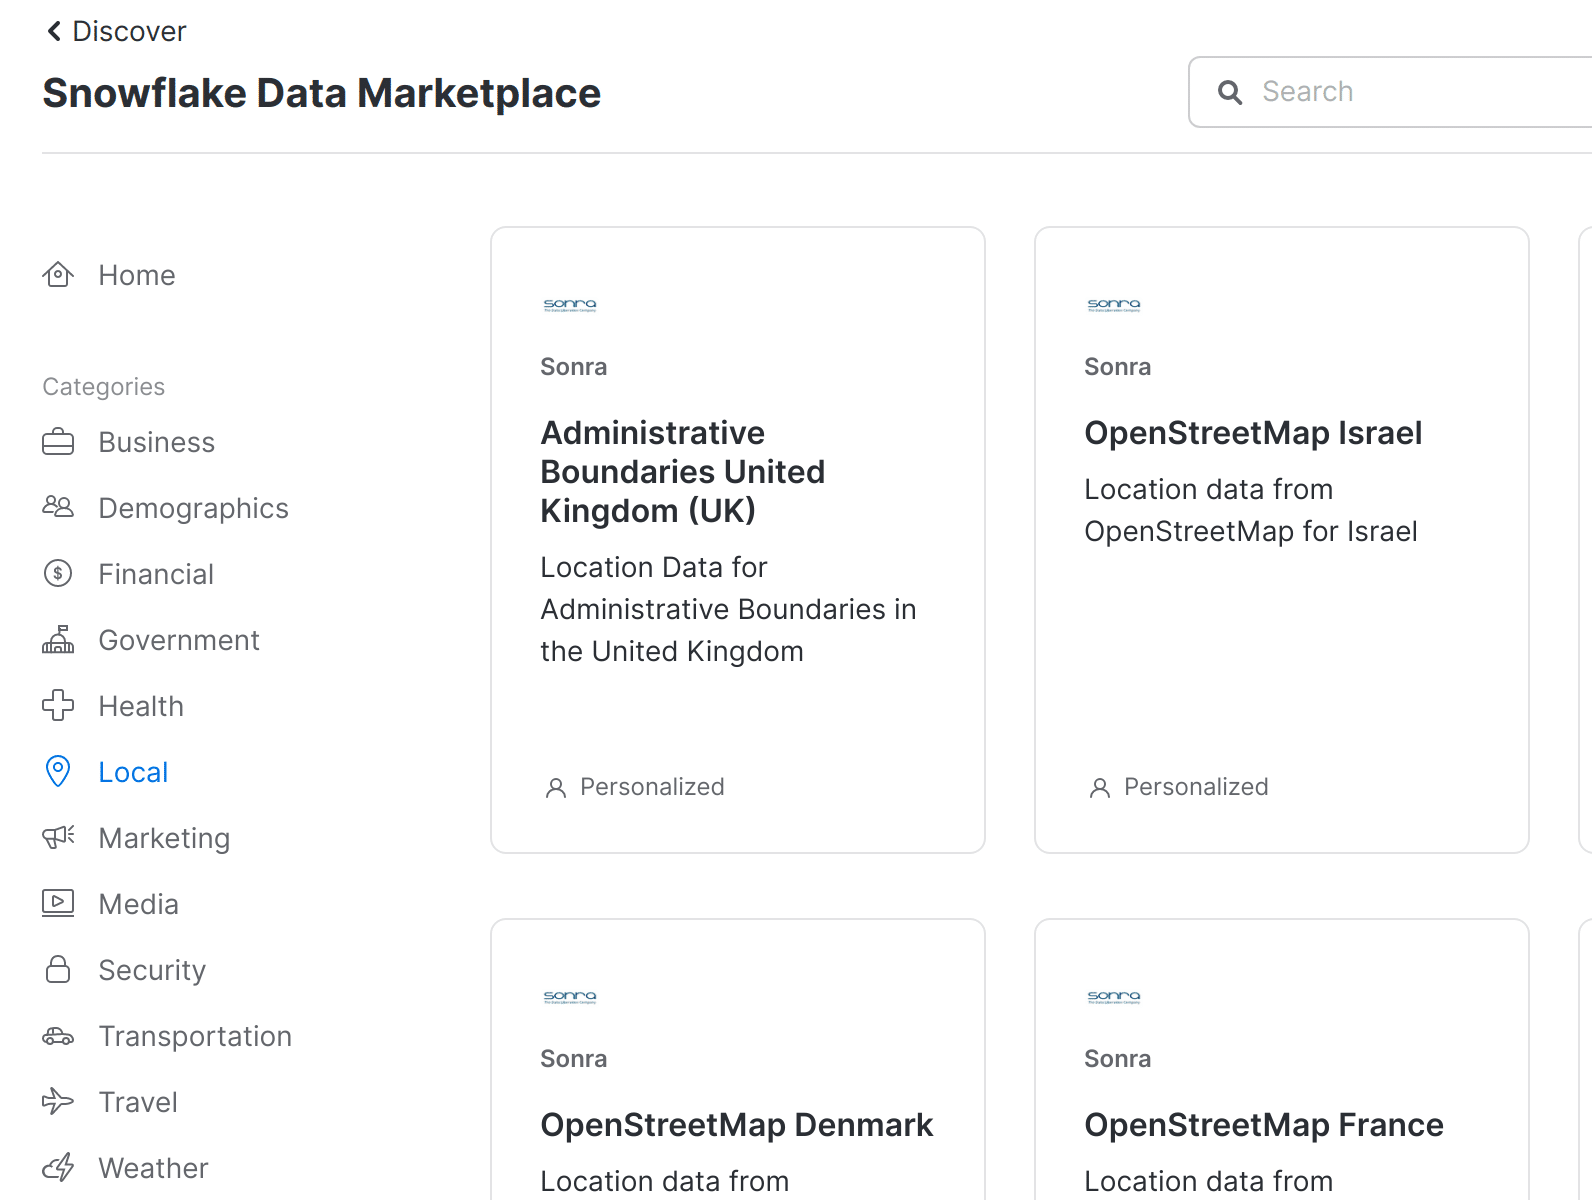
4. For OSM, Select the appropriate role and click on get data/request data.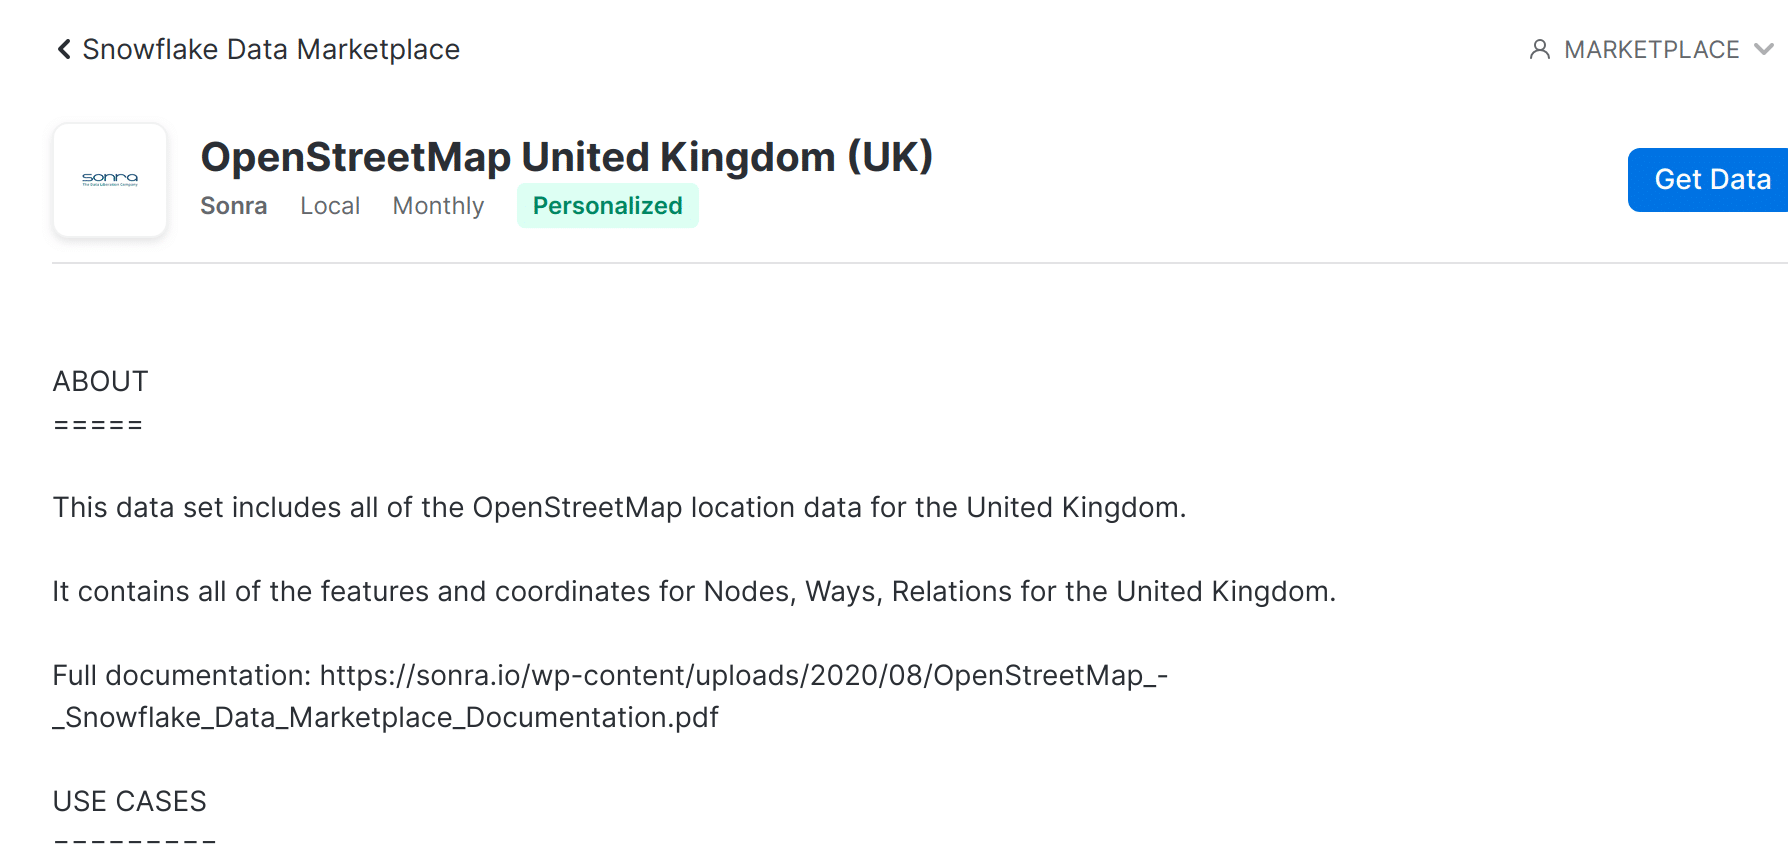
5. Fill the Database Name.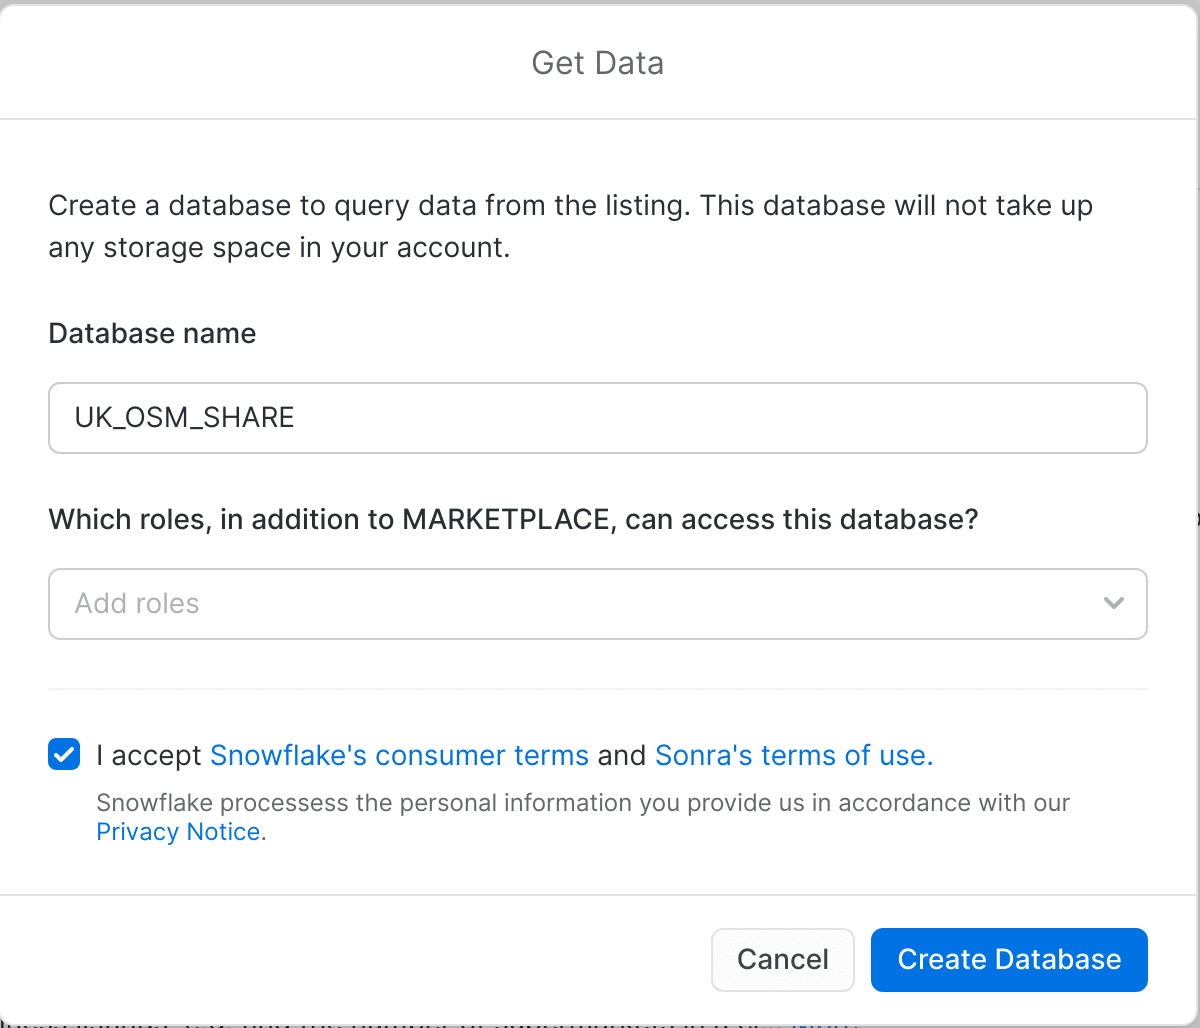
6. Same way we can get boundary data.
OSM Data
OSM data has three core elements, node, way and relation. Node is used to identify a point on the map. Way is an ordered list of nodes and is used to map streets, malls, supermarkets etc. Relation is an ordered list of nodes, ways and relation which helps us to get the geographic relationship between the elements.
For better understanding the OSM data please go through the following document
OSM – Snowflake Data Marketplace
Hierarchy of Administrative Boundaries in United Kingdom Data
This contains the administrative boundaries of the UK stored at various levels.
Administrative boundary data covers the geographic hierarchy of the national and local government in the UK. This multi-layered hierarchy is complicated by the differing structures in each constituent country of the UK.
Admin boundaries of the UK are divided into various groups which get further divided into sub groups. For a better understanding let’s have a look at this diagram.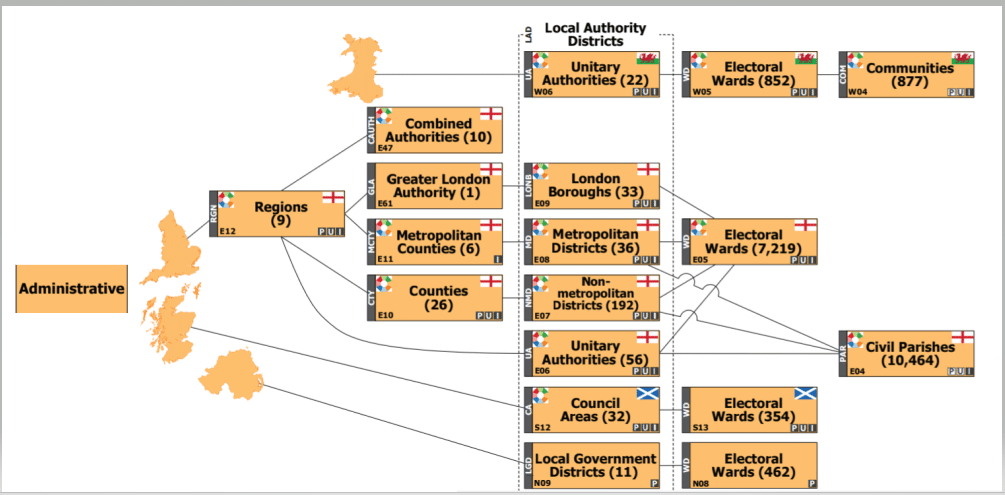
From the diagram we can see that the UK is divided into 4 countries, (England, Wales, Scotland and Northern Ireland). Each country is further divided, e.g. England is divided into Regions and then a Region is further divided into subcategories.
For better understanding the hierarchy and the lookup tables please go through the following link
UK Administrative Boundaries
You can also find our USA Administrative Boundaries dataset here.
Snowflake geospatial in action
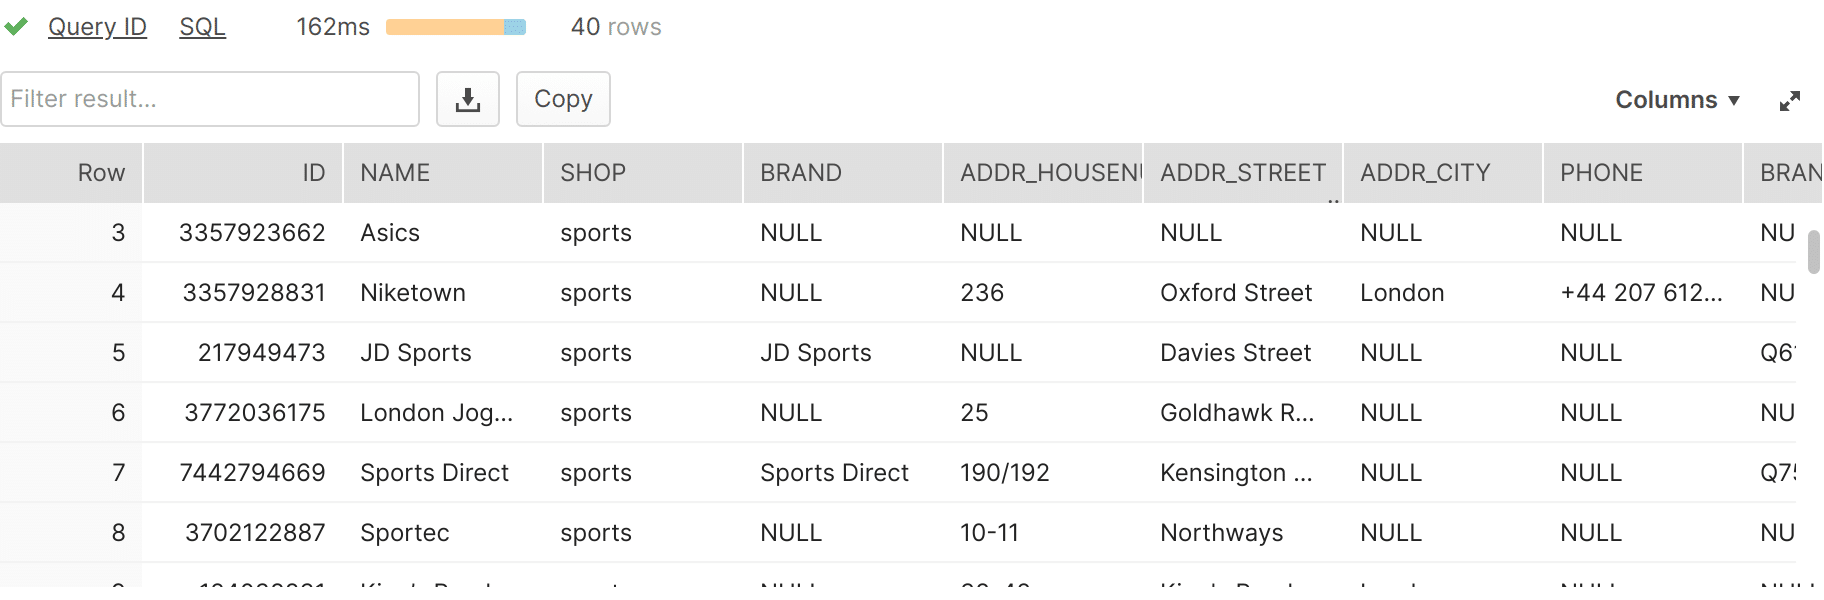
Example 1: Find all sport shops a radius of 5km from a property (ID ‘100’) and give the distance (in metres)
For distance we will use ST_DISTANCE function and for finding all sports shop within 5 km radius we will use ST_DWITHIN
SELECT
	SHOP.ID,
	SHOP.NAME,
	SHOP.SHOP,
	SHOP.BRAND,
	SHOP.ADDR_HOUSENUMBER,
	SHOP.ADDR_STREET,
	SHOP.ADDR_CITY,
	SHOP.PHONE,
	SHOP.BRAND_WIKIDATA,
	SHOP.BRAND_WIKIPEDIA,
	SHOP.OPENING_HOURS,
	SHOP.WEBSITE,
	ST_DISTANCE(PROP.COORDINATES,
	SHOP.COORDINATES)/ 1000 as DISTANCE_IN_KM,
	SHOP.COORDINATES,
	SHOP.TYPE
from
	PROPERTY PROP
inner join V_OSM_UK_SHOP SHOP on
	ST_DWITHIN(PROP.COORDINATES,
	SHOP.COORDINATES,
	5000)
WHERE
	PROP.INDEX = 100
	and SHOP.SHOP = 'sports';
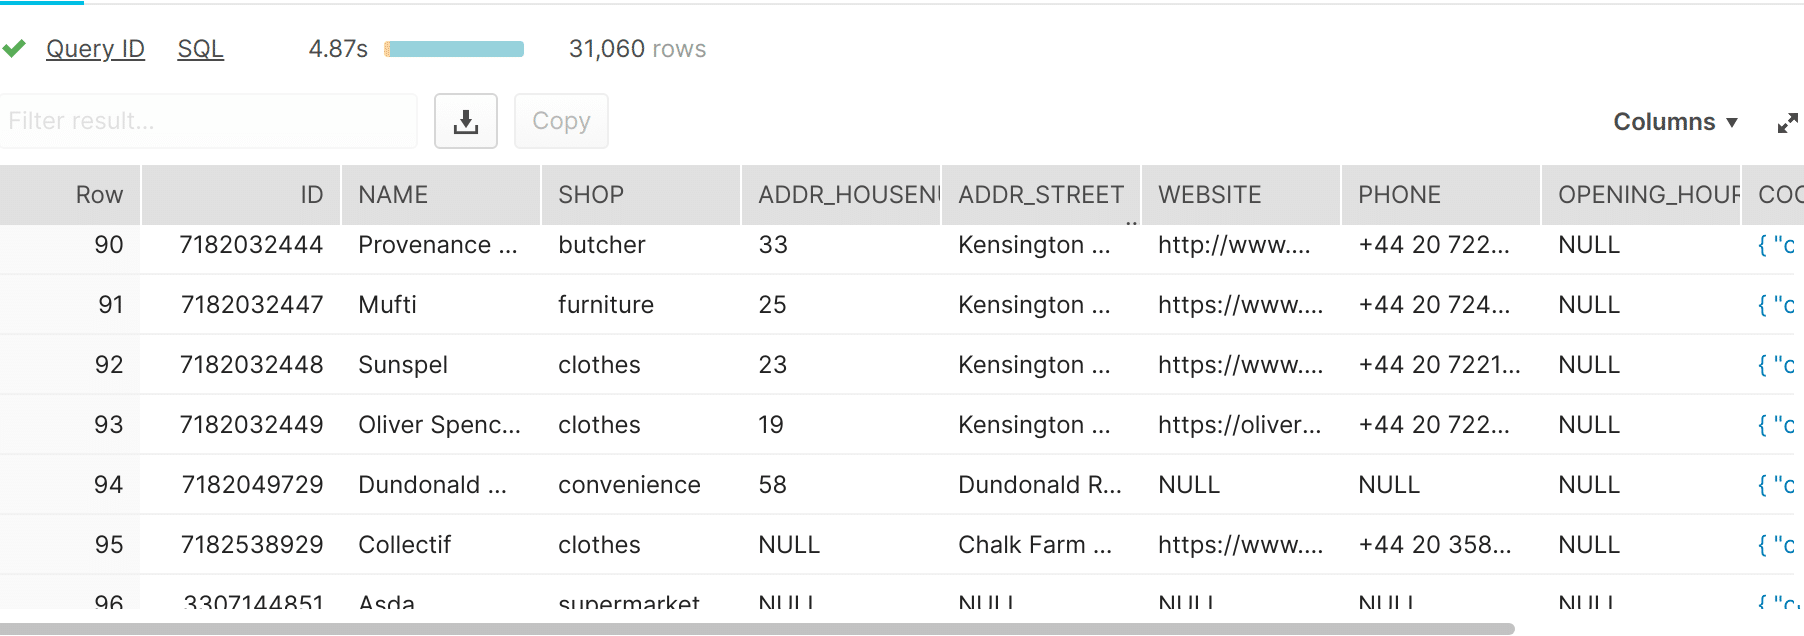
Example 2: Find all shops in Region LONDON
We will use ST_COVERS to find all shops within a Region. We will be using ST_CENTROID for shop data as ST_COVERS does not accept geometry collection as input and thus we take centroid of the data and then see which point lies in the region.
SELECT
	SHOP.ID,
	SHOP.NAME,
	SHOP.SHOP,
	SHOP.ADDR_HOUSENUMBER,
	SHOP.ADDR_STREET,
	SHOP.WEBSITE,
	SHOP.PHONE,
	SHOP.OPENING_HOURS,
	SHOP.COORDINATES,
	SHOP.TYPE
FROM
	V_ONS_UK_REGION_201912 REGION
INNER JOIN V_OSM_UK_SHOP SHOP ON
	ST_COVERS(REGION.COORDINATES,
	ST_CENTROID(SHOP.COORDINATES))
where
	RGN19CD = 'E12000007';
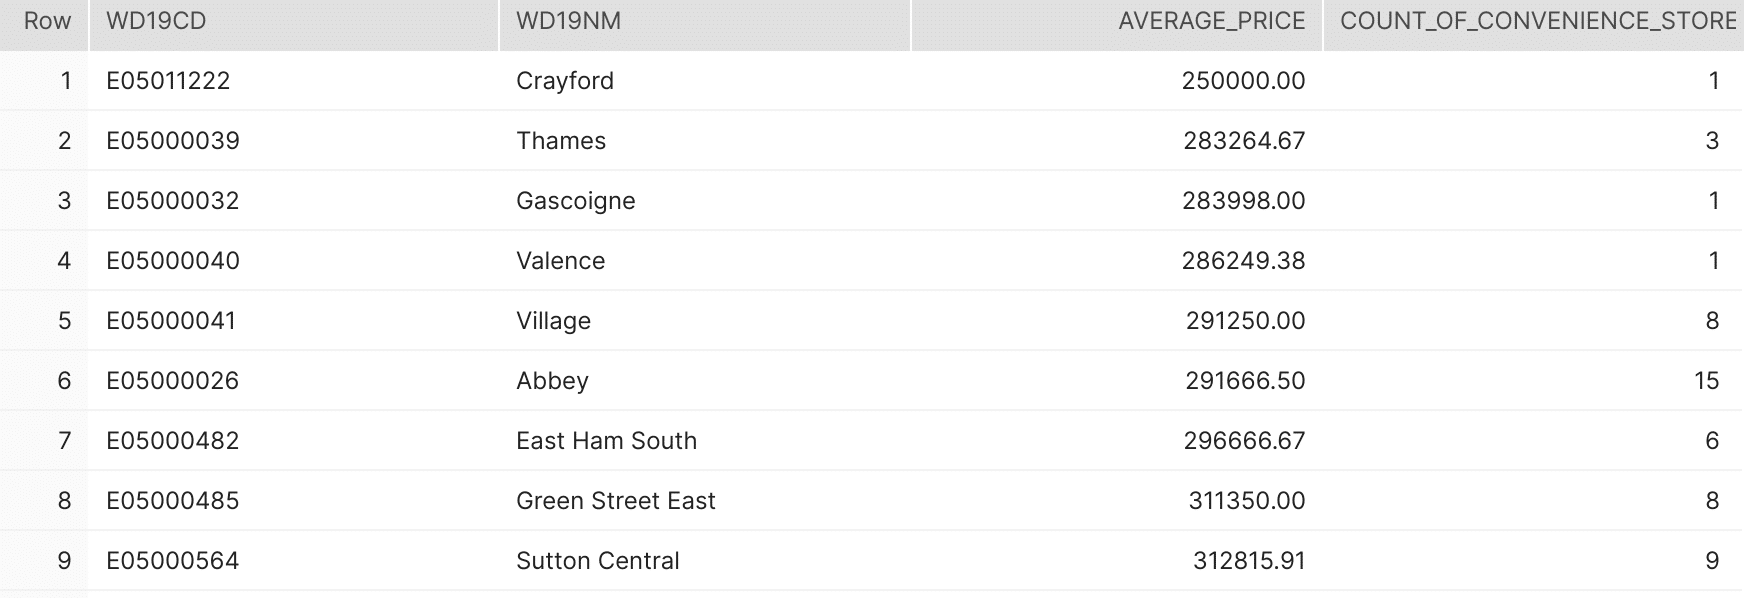
Example 3: List of Wards in London Region with average property prices and number of convenience stores
We will use ST_COVERS to find properties inside the wards and as a geometry collection is not accepted as input with ST_COVERS we can use ST_INTERSECTS as an alternative.
SELECT
	PROPERTY.WD19CD,
	PROPERTY.WD19NM,
	PROPERTY.AVERAGE_PRICE,
	OSM_SHOP.COUNT_OF_CONVENIENCE_STORE
FROM
	(
	SELECT
		WD19CD, WD19NM, ROUND(AVG(PRICES),
		2) AS AVERAGE_PRICE
	FROM
		PROPERTY PROP
	INNER JOIN (
		SELECT
			WARDS_INNER.*
		FROM
V_ONS_UK_LKP_WARD_LOCAL_AUTH_DIST_COUNTY_REGION_COUNTRY_201912 LKP
		INNER JOIN V_ONS_UK_WARD_201912 WARDS_INNER ON
			WARDS_INNER.WD19CD = LKP.WD19CD
		WHERE
			RGN19CD LIKE 'E12000007') WARDS ON
		ST_COVERS(WARDS.COORDINATES,
		PROP.COORDINATES)
	GROUP BY
		WD19CD, WD19NM) PROPERTY
INNER JOIN (
	SELECT
		WD19CD, WD19NM, COUNT(*) AS COUNT_OF_CONVENIENCE_STORE
	FROM
		V_OSM_UK_SHOP SHOP
	INNER JOIN (
		SELECT
			WARDS_INNER.*
		FROM
V_ONS_UK_LKP_WARD_LOCAL_AUTH_DIST_COUNTY_REGION_COUNTRY_201912 LKP
		INNER JOIN V_ONS_UK_WARD_201912 WARDS_INNER ON
			WARDS_INNER.WD19CD = LKP.WD19CD
		WHERE
			RGN19CD LIKE 'E12000007') WARDS ON
		ST_INTERSECTS(WARDS.COORDINATES,
		SHOP.COORDINATES)
	WHERE
		SHOP.SHOP = 'convenience'
	GROUP BY
		WD19CD, WD19NM) OSM_SHOP ON
	OSM_SHOP.WD19CD = PROPERTY.WD19CD
ORDER BY
AVERAGE_PRICE,
COUNT_OF_CONVENIENCE_STORE DESC;
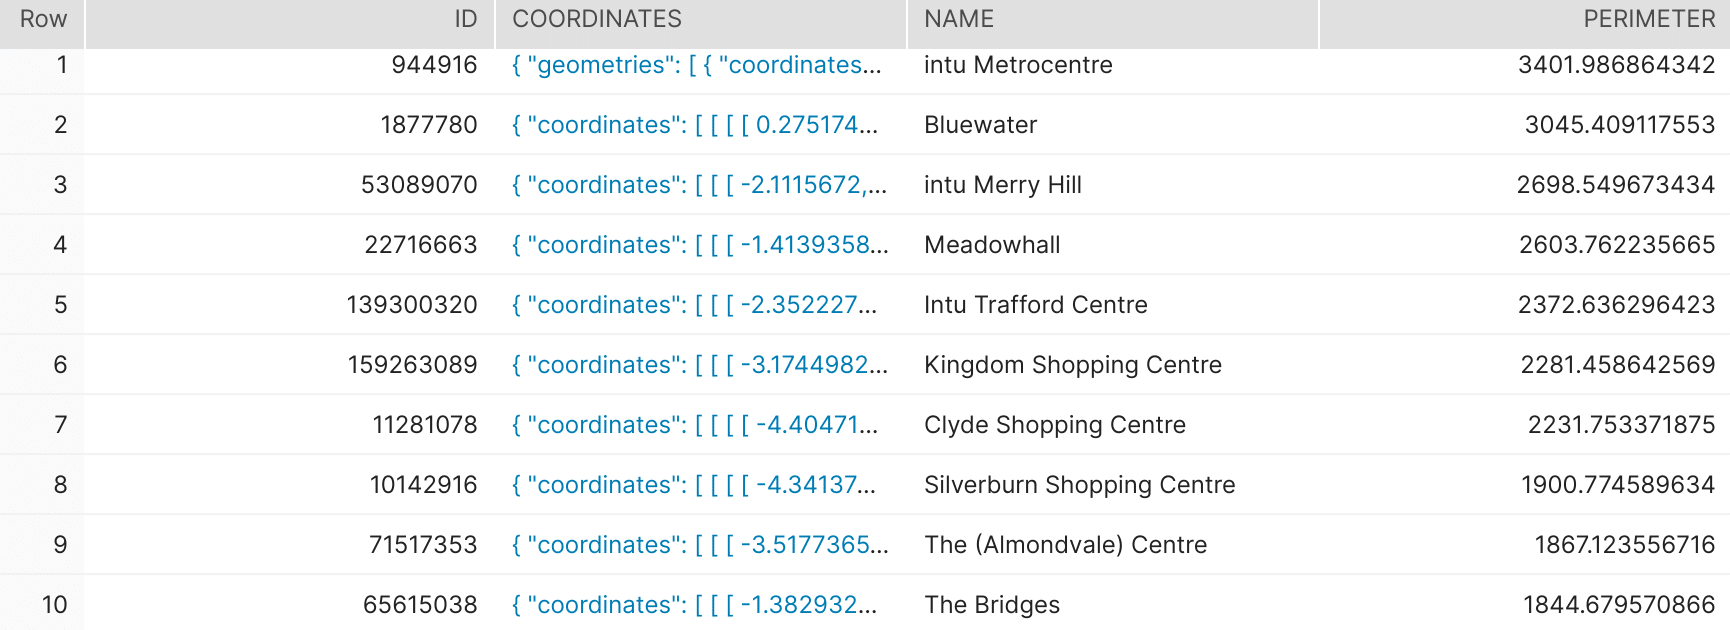
Example 4: Top 10 largest shopping malls in UK by perimeter
We will use ST_PERIMETER to calculate the perimeter of the polygon.
SELECT
	ID,
	COORDINATES,
	NAME,
	ST_PERIMETER(COORDINATES) AS PERIMETER
FROM
	V_OSM_UK_SHOP
WHERE
	SHOP = 'mall' QUALIFY RANK() OVER (ORDER BY PERIMETER DESC) <= 10;
Conclusion
In this blog post we have shown you the usefulness of location analytics and geospatial data for generating insights.
We also learned about the history of geospatial systems and we saw geospatial data and geo functions in action on the Snowflake data platform.
Last but not least we introduced you to the Snowflake data marketplace and showed you how useful data sets are just a short JOIN away.
We are offering various GEO datasets. You can find our offering here:
Uli Bethke
Uli has been rocking the data world since 2001. As the Co-founder of Sonra, the data liberation company, he’s on a mission to set data free. Uli doesn’t just talk the talk—he writes the books, leads the communities, and takes the stage as a conference speaker.
Any questions or comments for Uli? Connect with him on LinkedIn.
Follow Uli Bethke: