7 guardrails against common mistakes that inflate Snowflake credit usage

Dodge costly pitfalls
Snowflake implementation has pioneered dozens of innovations in the data platform space. The long list includes separation of compute and storage, physical workload separation, data sharing, data app marketplace and many more. One innovation is the pay per use pricing model and instant scalability of compute resources. You can command hundreds or even thousands of servers at a fingertip but only pay for the resources you actually use. What is not to like?
This is a powerful tool to manage costs and to scale your workloads. However, we all know: with great power comes great responsibility. Great flexibility and choice can come at a price. Mistakes and accidents can happen and are a part of life. As long as you learn your lessons and don’t repeat them. By keeping a close watch and implementing some important guardrails in Snowflake, you can either learn how to prevent future errors or even catch them just in time before they lead to compute bill pandemonium.
In this blog post, we will explore crucial safeguards that prevent unexpected surges in your Snowflake compute usage.
Snowed under by costs no more 😀
Right size your virtual warehouse… and monitor
In an ideal world we want to run our virtual warehouse at exactly 100% of capacity. Not at 101% and not at 99%. If we under-provision resources then queries start to slow down, to queue, or both. If we overprovision resources we leave compute on the table and pay more than we use.
Here are some rule of thumb sizing recommendations to help you get started with virtual warehouse sizing. They are based on the data size of the tables in your query. Start with the smallest recommended virtual warehouse size for the corresponding data size and then gradually scale up until there are no significant improvements anymore.
|
Data size |
VWH size |
|---|---|
| < 1 GB | XS S |
| 1- 20 GB | S M L XL 2XL |
| 20 – 50 GB | M L XL 2XL 3XL |
| > 50 GB | XL 2XL 3XL 4XL |
Under provisioning resources
When you underprovision resources you will see one or more of the following symptoms.
- Queries end up in the queue and need to wait until a slot becomes available. It’s similar to a popular night club. There just isn’t enough space for everyone. As a rule of thumb you can run 8 queries concurrently on an individual cluster in Snowflake. Each query takes up one vCPU.
- Queries spill to disk
- Your queries take longer to run than normally
You can identify all of these issues by looking at the account usage views. Reach out to us if you need help with this.
There are various strategies you can use to address these issues
- You can increase the size of your virtual warehouse. This is useful for CPU intensive queries but also for situations where queries end up in the queue. This does not increase the degree of parallelism. It will be 8 independent of the size of your VWH. However, it cuts the execution time of queries in half when you also double the virtual warehouse size (this works for most but not all workloads). As such the queue times are also cut in half and queries come off the queue much faster.
- Queries spill to disk when a virtual warehouse runs out of memory during certain operations such as joins. The root cause of this problem often is bad SQL code or bad physical database design (missing cluster keys etc.). When queries spill to disk the first step should be to optimise the query itself and tune the physical database design. This should reduce memory consumption. Alternatively, Snowflake datalake architecture has introduced memory optimised virtual warehouses. They are branded as Snowpark optimised but memory intensive workloads in general benefit from this boxes with a huge amount of RAM.
- If you have a large number of concurrent queries you can run multiple virtual warehouses concurrently. This will actually increase the degree of parallelism and reduce queuing even further. You can combine a larger virtual warehouse with concurrent virtual warehouses to empty any queue.
- Use Snowflake query acceleration if your query involves a large table scan or other very expensive operations. Query acceleration offloads the table scan part of the explain plan to additional compute resources to free up resources on the virtual warehouse itself.
Overprovisioning resources
A new feature called Warehouse utilisation metrics will be rolled out soon. It is currently in private preview and shows the utilisation of resources as a percentage per virtual warehouse.
The remedy for overprovisioning resources is to scale down your virtual warehouse, e.g. from L to M or to combine workloads on the same virtual warehouse, e.g. instead of having two underutilised virtual warehouses for Sales and HR you could combine the workload on a single virtual warehouse.
Autosuspend virtual warehouses! BUT keep workload type in mind
Most of you probably know that it is best practice to set your Snowflake virtual warehouses to autosuspend and auto resume. However, there is a catch that some of you might not be aware of.
Skip to the final SQL?
If you want to skip ahead and see the final SQL implementation, you can head straight to the end!
By auto suspending a virtual warehouse too quickly you will flush the cache of the warehouse. Subsequent queries that resume the warehouse need to reseed the cache. You will see a temporary degradation in performance when the VWH resumes. It’s a classic tradeoff. You save on compute costs but lose on query performance. You will need to find a balance between saving costs by suspending quickly and benefiting from Snowflake’s caching.
The balance depends on the type of workload. Some types of workloads benefit more from caching than others.
- As a rule of thumb ETL workloads do not benefit much from caching. For these workloads you can autosuspend your virtual warehouse immediately.
- BI style queries benefit from caching and as a rule of thumb you should set to suspend your warehouse after 10 minutes of idle time.
Here is a query to identify virtual warehouses that might benefit from shorter suspension times. I have “borrowed” it from the excellent post deep dive into Snowflake compute by Snowflake’s Samartha Chandrashekar.
|
1 2 3 4 5 6 7 8 9 10 11 12 |
SELECT WAREHOUSE_NAME ,COUNT(*) AS QUERY_COUNT ,SUM(BYTES_SCANNED) AS BYTES_SCANNED ,SUM(BYTES_SCANNED*PERCENTAGE_SCANNED_FROM_CACHE) AS BYTES_SCANNED_FROM_CACHE ,SUM(BYTES_SCANNED*PERCENTAGE_SCANNED_FROM_CACHE)/SUM(BYTES_SCANNED) AS PERCENT_SCANNED_FROM_CACHE FROM "SNOWFLAKE"."ACCOUNT_USAGE"."QUERY_HISTORY" WHERE START_TIME>=dateadd(month ,-1 ,CURRENT_TIMESTAMP()) AND BYTES_SCANNED>0 GROUP BY 1 ORDER BY 5 ; |
The query identifies virtual warehouses that don’t tap into the cache frequently. This may mean that they are suspended too quickly. Only use this query for virtual warehouses running BI or interactive query workloads. It is not relevant for ETL workloads.
Here are some tips and tricks for successfully using autosuspend in Snowflake
- Monitor for virtual warehouses that do not have auto resume and auto suspend enabled.
- Understand Workload Patterns: Before setting an auto-suspend duration, analyse your workload’s activity patterns to understand the typical idle times.
- Opt for a Conservative Start: Begin with a conservative auto-suspend value to avoid premature suspensions. Monitor its impact and adjust based on actual usage patterns.
- Pair with AUTO_RESUME: Ensure that the AUTO_RESUME feature is enabled. This allows the virtual warehouse to automatically restart when a new query is submitted, providing a seamless experience to users.
- Be Cautious with Short Durations: Setting an extremely short auto-suspend time can lead to frequent suspensions and resumptions. This might introduce cache seeding latencies when queries are executed after resumption.
Kill long running queries! BUT keep workload type in mind.
Another useful autosuspend feature is to terminate very long running queries after they hit a threshold. The parameter STATEMENT_TIMEOUT_IN_SECONDS automatically kills long running queries when they hit the timeout threshold.
Don’t make the mistake of setting the STATEMENT_TIMEOUT_IN_SECONDS param at the account level. The threshold varies by workload and should be set at the virtual warehouse level (assuming you follow best practice and split out your workloads by virtual warehouse).
- For ETL workloads set the threshold to several minutes or even an hour. If single queries regularly run for more than an hour you probably have a more fundamental problem and should optimise your ETL query. Split it into smaller and more manageable chunks. Increase your virtual warehouse size etc.
- For BI workloads this should be set to a few minutes max. If your users have to wait for minutes to get their reports you have another problem.
- Interactive workloads such as data discovery sit in the middle of the previous two. 15-20 minutes is a good value to start with.
Here are some more tips and tricks for finding the right value for STATEMENT_TIMEOUT_IN_SECONDS
- Establish a Baseline: Before setting a default timeout, monitor the duration of typical queries for each workload to get an idea of what an appropriate timeout might be.
- Set STATEMENT_TIMEOUT_IN_SECONDS at the workload / virtual warehouse level.
- Educate Users: Make sure that users and developers are aware of the timeout setting. This way, if their queries are terminated due to a timeout, they understand why.
- Optimise Long Queries: If you find certain queries are consistently being terminated due to timeouts, it might be an indication that they need optimization.
- Use with Care for Critical Workloads: Be cautious when setting this parameter for critical workloads or ETL processes. Setting it too aggressively might disrupt important processes.
- Monitoring and Alerting: Set up monitoring and alerts to be informed when queries are terminated due to this timeout. This can help in identifying potential issues or patterns.
- Consider Ad-hoc vs. Scheduled Jobs: You might want to have different timeout settings for ad-hoc queries (run by analysts, for example) versus scheduled jobs or processes.
- Documentation: Always document the rationale behind the chosen timeout value, especially if you set it at a non-default value. This aids in transparency and future troubleshooting.
Don’t overschedule tasks and pipelines
One common source of accidents and bad practices is to overschedule tasks and pipelines.
An example: Engineers set up a task or alert to run every minute to test a feature but then forget to disable the task. This is akin to a virtual warehouse running 24/7 without auto suspend.
You can get the full list of scheduled tasks from the account usage views TASK_HISTORY and SERVERLESS_TASK_HISTORY. Set up an alert against these views to identify frequently running tasks.
For alerting and notifications use the same virtual warehouse. If you already have a virtual warehouse that is running 24/7 then use this VWH for alerts.
When pipelines are scheduled more frequently than necessary, it results in unnecessary data processing and compute usage. I often see data pipelines scheduled to process data in realtime or as a stream for no good business reason. Most use cases don’t require data to be updated every minute. Always question the business value of a real time use case by asking the question: what action do you take in near real time based on the insights you get in real time. Often you get blank stares in return.
Alert for credit usage outliers
A good way to detect accidental usage or overconsumption is to monitor for compute outliers. It’s a two step process.
Step 1: Create a baseline of your typical credit usage.
Creating a baseline can be done by looking at your historical data in the account usage view WAREHOUSE_METERING_HISTORY and usage views for serverless compute such as AUTOMATIC_CLUSTERING_HISTORY. The purpose of the baseline is to establish what’s “normal” usage for your operations. This can be done by calculating the rolling average of your daily / weekly credit consumption.
Step 2: Set Thresholds.
Based on your historical analysis, set thresholds (e.g., rolling average + 2x standard deviations) to detect credit usage outliers. Anything beyond this threshold can be considered an anomaly or outlier. Outliers require further investigation and drill down into account usage views to identify the root cause(s) of the problem.
Experiment with new features… but keep data volumes small
Carefully test new features on smaller data volumes before rolling them out for larger volumes. Setting up secondary indexes through Search Optimisation Services is great to speed up lookups but can be catastrophic when not planned properly for TB sized tables in a production environment.
And one final tip: read the manual before testing a new feature. It always surprises me that a majority of engineers don’t read the docs or just scan them superficially.
Prevent SQL query catastrophe
Snowflake makes the life of data engineers and SQL developers much easier compared to older platforms such as Redshift or Azure Synapse. While you don’t have to worry about sort keys, distribution keys, table statistics and other nuisances such as manual workload management you still need to be knowledgeable when it comes to writing good SQL code.
In this sense Snowflake is similar to ChatGPT. It speeds up and automates boring tasks and generally makes life easier. BUT! And it is a big BUT. It is not a silver bullet. You still need to be knowledgeable around SQL and databases in general. Also beware of SQL code accidents. They happen all the time as we will see in a minute.
So the last tip on our list to prevent compute accidents from happening on Snowflake is to monitor and review SQL for common anti patterns.
We created FlowHigh SQL Analyser for static and dynamic SQL code analysis. It is available as a Snowflake native app. You can also use the FlowHigh SDK for programmatic access and the FlowHigh UI.
Request access to the Snowflake native app of FlowHigh Analyser
We first installed the FlowHigh native app into our Snowflake instance. It ships the User Defined Table Function GET_AP to detect anti patterns in SQL.

We ship a sample SQL with anti patterns. It is available in the View BAD_SQL_CORPUS.
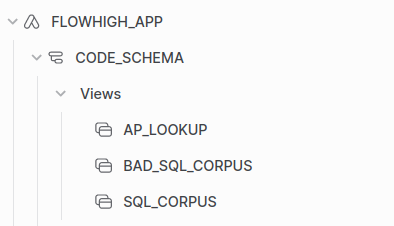
Let’s run FlowHigh to detect anti patterns in the sample in View BAD_SQL_CORPUS.
|
1 2 3 4 5 6 7 8 9 10 11 |
SELECT SQL_QUERY ,AP_NAME ,POS ,STATUS ,STATUS_MSG ,AP_QUERY_PART FROM FLOWHIGH_APP.CODE_SCHEMA.BAD_SQL_CORPUS corpus CROSS JOIN TABLE(FLOWHIGH_APP.CODE_SCHEMA.get_ap(corpus.SQL_QUERY ,TRUE ,FALSE)) ap ; |
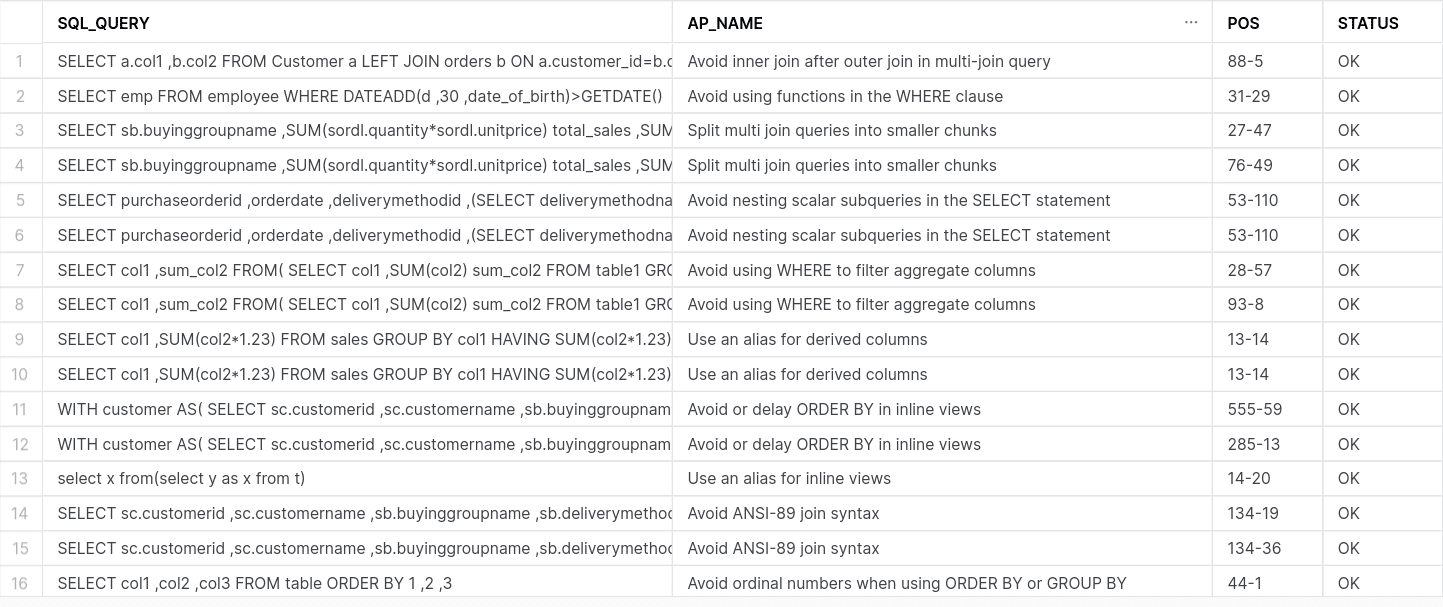
We get the SQL query, the name of the anti pattern. The start position of the anti pattern and the offset from there.
You can view the anti patterns of a query in your browser by logging into the FlowHigh web UI
Dynamic SQL code analysis on Snowflake
One use case is to continuously check the SQL query history for bad SQL. This is called dynamic SQL code analysis
You can also use the FlowHigh SDK for static code analysis as part of a CI / CD testing pipeline. This is useful to apply quality assurance to your SQL code before it is deployed to a UAT or production environment.
In this section we will focus on dynamic SQL code analysis.
For dynamically monitoring the Snowflake query history we set up a Snowflake Task that scans the query history every 5 minutes for bad SQL. You can also set up an alert for severe anti patterns.
The Snowflake Task calls a Stored Procedure.
The Stored Procedure checks the query history every few minutes for bad SQL and writes the output to a log table.
We have put the source code into the appendix.
We scanned the query history of a live environment for bad SQL. Here is what we found
Using GET_AP, we scanned the Snowflake query history of a live environment for bad SQL. We analysed actual SQL code from a production environment written by data engineers and data analysts.
You will need permissions on the account usage view query_history to run this query
Here is the code we used
|
1 2 3 4 5 6 7 8 9 10 11 12 13 |
SELECT QUERY_ID ,QUERY_TEXT ,AP_TYPE ,POS ,STATUS ,STATUS_MSG ,AP_QUERY_PART FROM snowflake.account_usage.query_history corpus CROSS JOIN TABLE(FLOWHIGH_APP.CODE_SCHEMA.get_ap(corpus.QUERY_TEXT ,TRUE ,FALSE)) ap WHERE query_type='SELECT' |
… and here is what we found.
In total we scanned ~9.8M SQL queries.
We came across a total of ~3.4M anti patterns, which means that some queries contained more than one anti pattern. In one particular query we came across no less than 80 anti patterns.
Let’s have a look at the different anti patterns we detected:
| AP_NAME | NUM_AP |
|---|---|
| Beware of SELECT * | 680,910 |
| Beware of SELECT DISTINCT | 449,167 |
| Use an alias for inline views | 155,655 |
| Beware of NULL in combination with not equal operator (!=, <>) | 108,607 |
| Avoid using functions in the WHERE clause | 91,539 |
| Use an alias for derived columns | 78,849 |
| Use IN / NOT IN for multiple OR operators | 59,476 |
| Avoid implicit column references | 50,736 |
| WHERE NOT IN without NOT NULL check in subquery | 49,187 |
| Beware of count distinct | 11,826 |
| Avoid using functions in the Join clause | 5,514 |
| Avoid ordinal numbers when using ORDER BY or GROUP BY | 5,057 |
| Beware of implicit self-joins in a correlated subquery | 4,373 |
| Avoid implicit cross join | 3,613 |
| Avoid UNION for multiple filter values | 1,373 |
| Avoid filtering attributes from the non-preserved side of an outer join | 1,167 |
| Use UNION ALL instead of UNION | 1,054 |
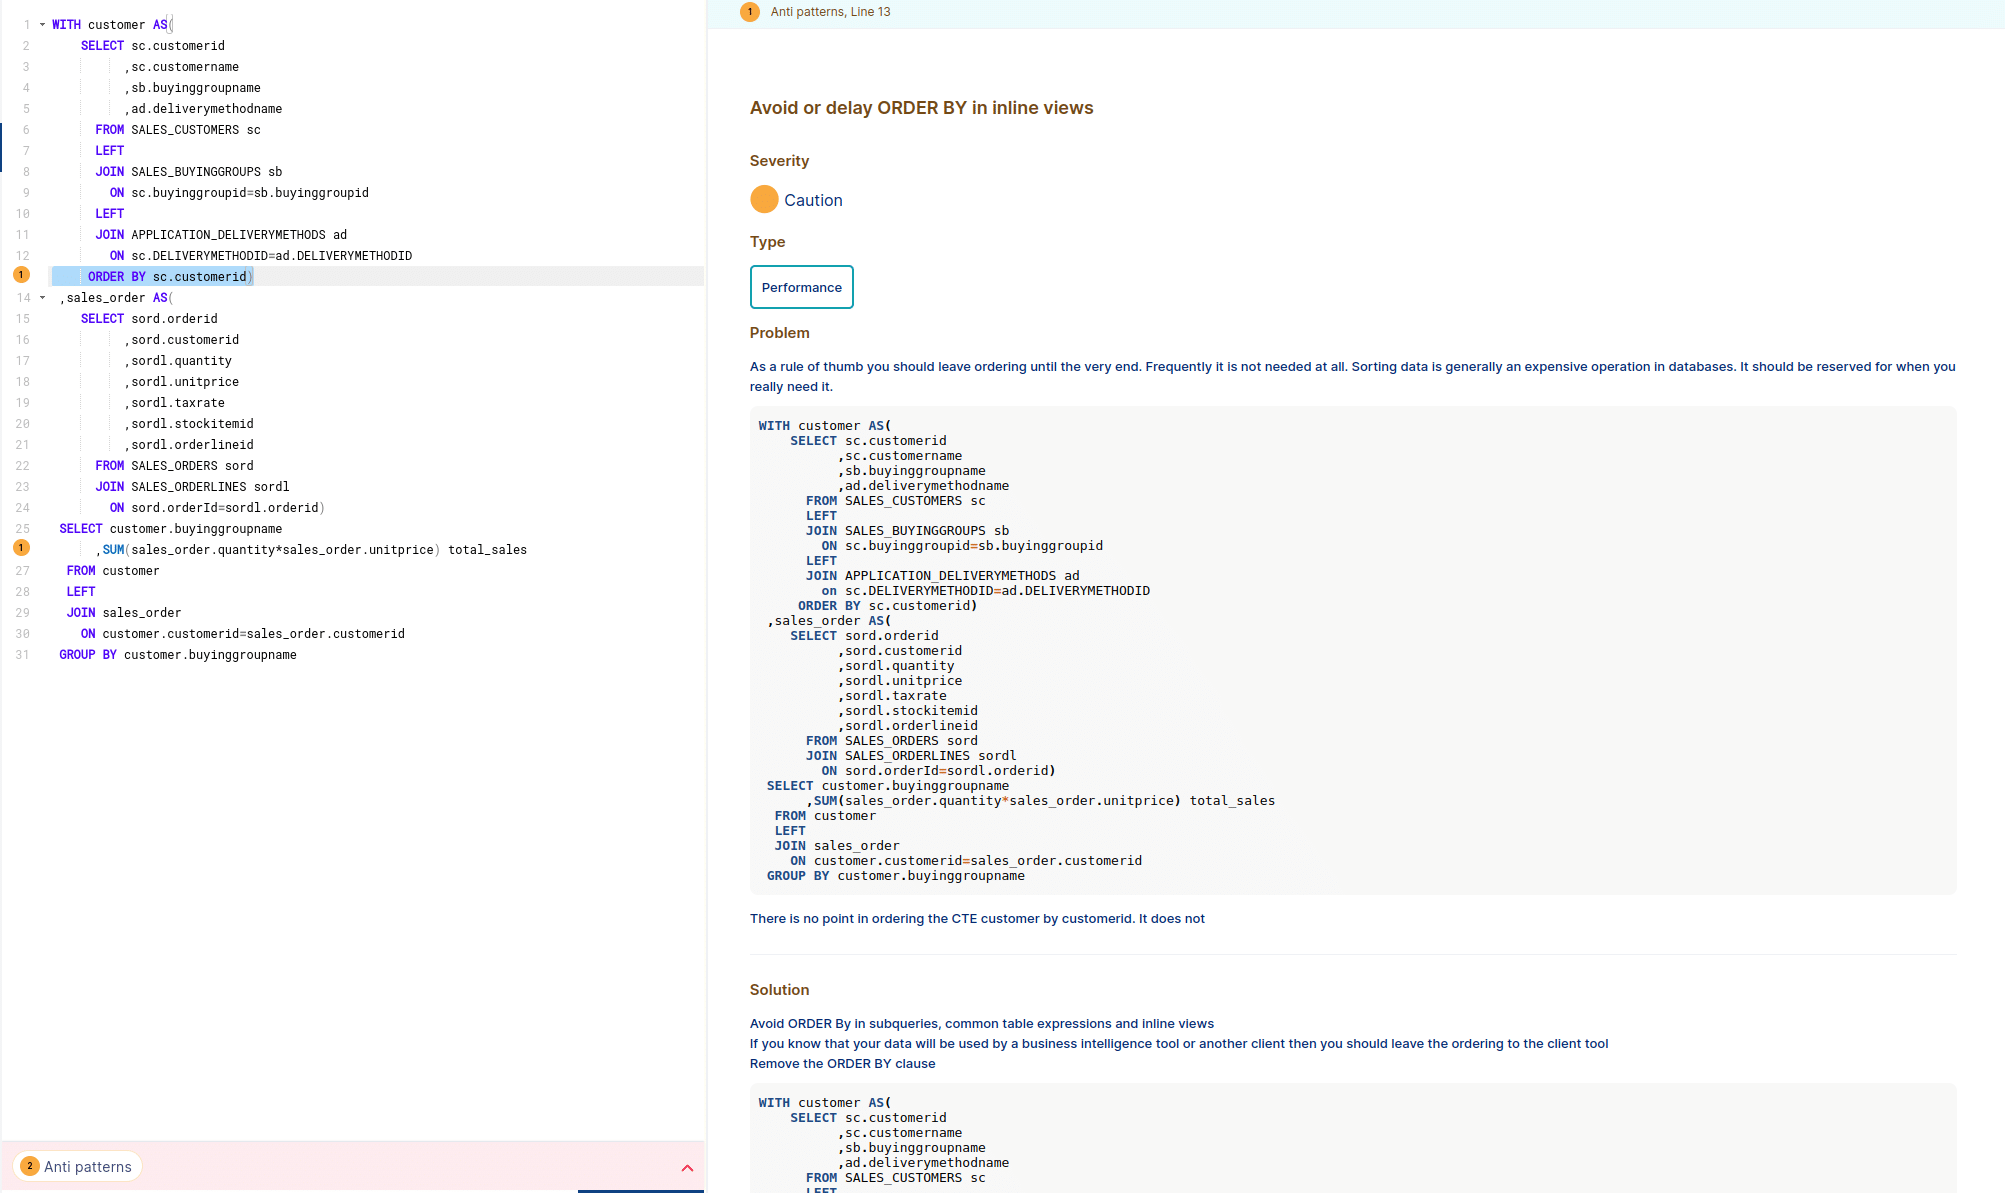
| Avoid or delay ORDER BY in inline views | 796 |
| Use parentheses when mixing ANDs with ORs | 753 |
| Beware of NULL with arithmetic and string operations | 672 |
| Avoid unused Common Table Expressions (CTE) | 454 |
| Avoid using WHERE to filter aggregate columns | 382 |
| Use window functions instead of self joins | 89 |
| Avoid ANSI-89 join syntax | 8 |
| Avoid inner join after outer join in multi-join query | 8 |
| Avoid nesting scalar subqueries in the SELECT statement | 6 |
| Avoid count(*) in the outer join | 4 |
| Split multi join queries into smaller chunks | 2 |
| Beware of filtering for NULL | 1 |
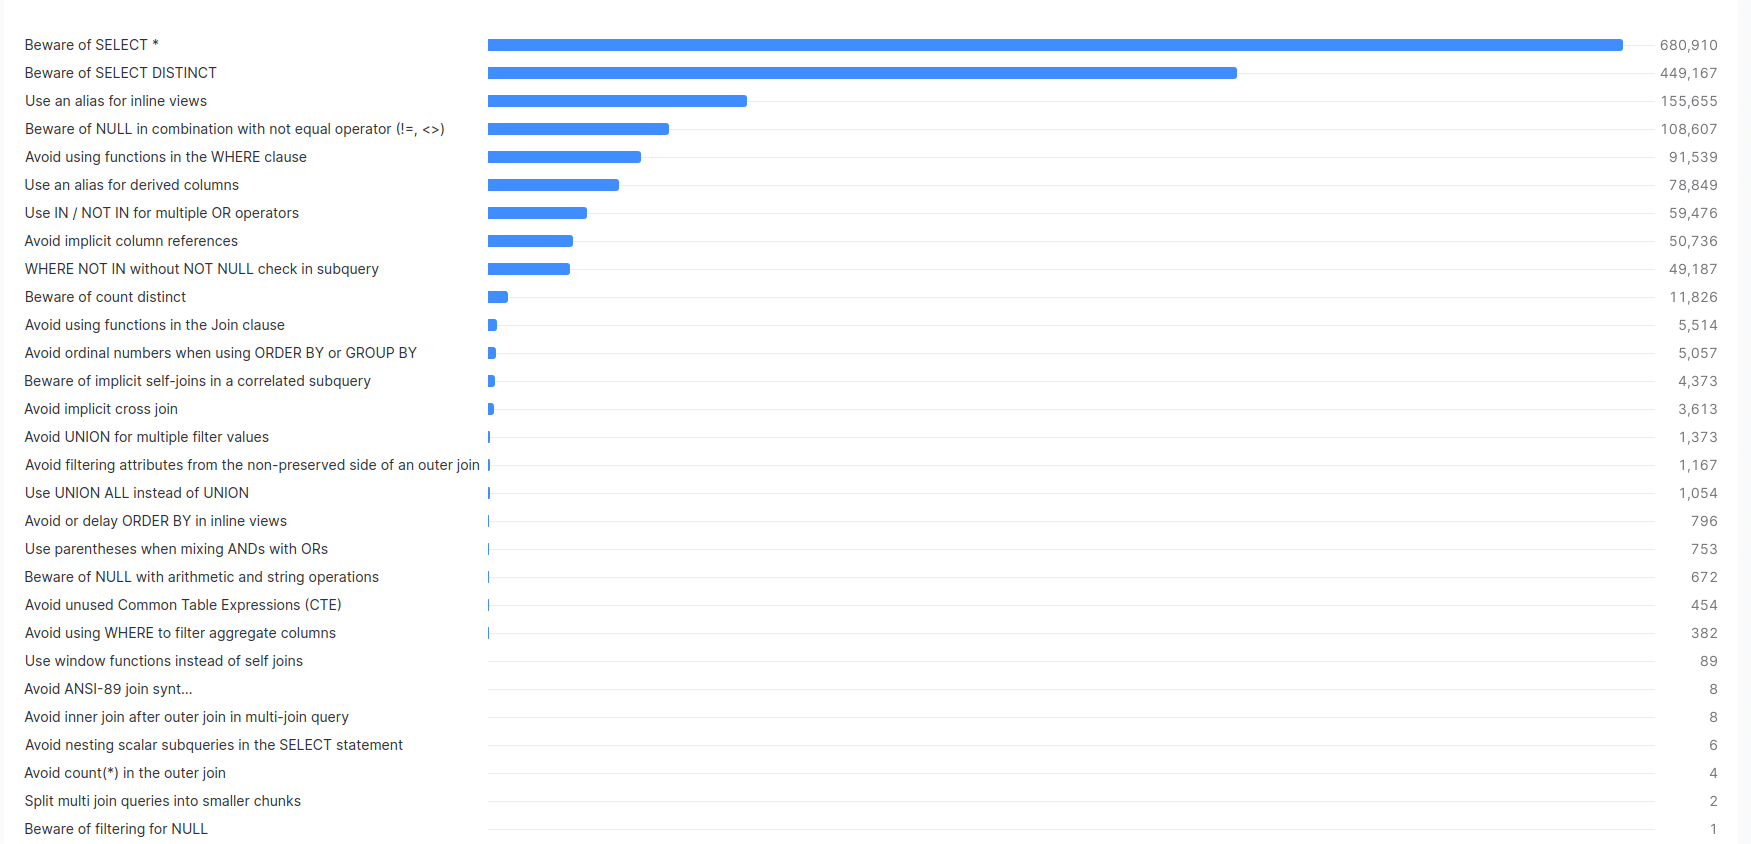
Screenshot from Snowsight that shows the anti patterns and their frequency.
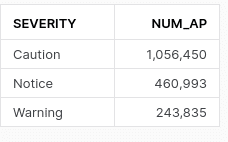
We came across 29 different types of SQL anti pattern with three different severity types.
Let’s examine anti-patterns based on their severity levels. In FlowHigh, the most critical anti pattern is a “Warning.” This designation is primarily for anti-patterns that yield inaccurate data, unexpected data, or significantly impair performance.
SELECT * is the most frequent anti pattern we detected. We came across it ~680K times. SELECT * can wreak havoc on your Snowflake database when not managed properly. I have compiled a post on the bad side effects of SELECT *.
Evil SQL: Result multiplication
Let’s drill into a particularly bad piece of SQL code we found around query result multiplication. This anti pattern is super bad and deserves to be called evil SQL 👿. It wreaks havoc on both performance and correctness. If the query in question is run frequently and remains undetected it will drive up your compute bill sky high.
Implicit cross joins
Result multiplication happens when the engineer makes a mistake when joining one or more tables. A classic example is a cross join where the developer forgets to specify the join condition. This results in a cartesian product, a multiplication of the rows in the tables being joined. If you have 1M rows in table A and 10M rows in table B and you join them without a join condition you will get 10000000000000 rows 😱. These types of mistakes can bring Snowflake (or any database) to a standstill.
Cross joins
are a valid approach for many scenarios and not all cross joins are evil, quite the opposite if used with deliberation and care. What you should definitely avoid are implicit cross joins where you don’t use the CROSS JOIN syntax to make your intent explicit.
Alias typos. Small detail but huge impact
Another example for a potential multiplication of the resultset is when the engineer mixes up table alias names in the join condition or when the engineer joins on the wrong columns in an inner or outer join.
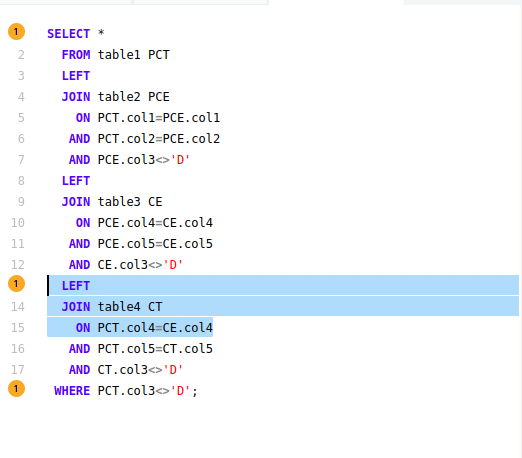
In the corpus of data that we scanned we came across the following piece of bad SQL.
|
1 2 3 4 5 6 7 8 9 10 11 12 13 14 15 16 17 18 |
SELECT * FROM table1 PCT LEFT JOIN table2 PCE ON PCT.col1=PCE.col1 AND PCT.col2=PCE.col2 AND PCE.col3<>'D' LEFT JOIN table3 CE ON PCE.col4=CE.col4 AND PCE.col5=CE.col5 AND CE.col3<>'D' LEFT JOIN table4 CT ON PCT.col4=CE.col4 AND PCT.col5=CT.col5 AND CT.col3<>'D' WHERE PCT.col3<>'D'; |
The names of the tables
were changed for confidentiality reasons but we left the alias names as per original query.
I have highlighted the offending line in bold.
The join condition is PCT.col4=CE.col4. However it should be CT.col4=CE.col4. A typo with far reaching consequences. Instead of joining table4 with alias CT we join to table3 with alias CE. Instead of using the expected alias CT the query uses the alias PCT which refers to an entirely different table.
FlowHigh detects this anti pattern and we can also visualise it in the UI.
Let’s have a look at the impact of this typo by looking at performance metrics for this query from the query history.

The query used a large virtual warehouse and it took ~19 minutes to run it. We read ~11 GB of data and produced more than 3 billion rows. A nasty metric is the spilling to disk: ~4 GB spilled to disk. Probably a direct result of the incorrect join condition not fitting into memory. Spilling to disk significantly slows down query performance.
These numbers are not pretty and you really should avoid this anti pattern.
This bring us to the end of this blog post on accident prevention on Snowflake.
Contact us if you would like to discuss any of the points outlined in this post.
Request access to FlowHigh SQL analyser to detect and prevent query catastrophe on your Snowflake instance.
Appendix
This stored procedure, SCAN_QUERY_HISTORY_FOR_ANTIPATTERNS, retrieves the most recent query start time from a specific task’s history. Depending on whether this start time is available (not null), the procedure extracts different sets of query histories and identifies potential anti-patterns within them.
|
1 2 3 4 5 6 7 8 9 10 11 12 13 14 15 16 17 18 19 20 21 22 23 24 25 26 27 28 29 30 31 32 33 34 35 36 37 38 39 40 41 42 43 44 45 46 47 48 49 50 51 52 53 54 55 56 57 |
CREATE OR REPLACE PROCEDURE SCAN_QUERY_HISTORY_FOR_ANTIPATTERNS() RETURNS STRING LANGUAGE JAVASCRIPT EXECUTE AS CALLER AS $ /* Stored Procedure: SCAN_QUERY_HISTORY_FOR_ANTIPATTERNS Description: This SP retrieves query history based on a specified warehouse and identifies potential anti-patterns in the queries. */ var result_set1, completed_time, final_query, sql_command3, cte_query; // First Query to get Start time result_set1 = snowflake.execute({sqlText: ` SELECT TO_VARCHAR(QUERY_START_TIME, 'YYYY-MM-DD HH24:MI:SS') AS FormattedTime FROM TABLE(information_schema.task_history(task_name=>'FIND_ANTIPATTERN_FROM_QUERY_HISTORY')) QUALIFY ROW_NUMBER() OVER (ORDER BY QUERY_START_TIME DESC) = 1; `}); // Determine if the task invoking this stored procedure is executing for the first time. result_set1.next(); completed_time = result_set1.getColumnValue(1); if (completed_time === null) { // This function retrieves query history based on the specified warehouse. // The RESULT_LIMIT parameter specifies the maximum number of rows to return, with a range from 1 to 10,000. // If RESULT_LIMIT is not specified, the default value is 100. insert_query = `INSERT INTO AP_OUTPUT(QUERY_ID, QUERY_TEXT, AP_TYPE, POS, STATUS, STATUS_MSG, AP_QUERY_PART) WITH FilteredQueries AS ( SELECT QUERY_ID, QUERY_TEXT FROM TABLE(information_schema.query_history_by_warehouse(RESULT_LIMIT => 10000)) WHERE QUERY_TEXT NOT LIKE 'CREATE%' ) SELECT QUERY_ID, QUERY_TEXT, AP_TYPE, POS, STATUS, STATUS_MSG, AP_QUERY_PART FROM FilteredQueries f, LATERAL FLOWHIGH_APP.CODE_SCHEMA.get_ap(f.QUERY_TEXT, true, false) a;`; } else { insert_query = `INSERT INTO AP_OUTPUT(QUERY_ID, QUERY_TEXT, AP_TYPE, POS, STATUS, STATUS_MSG, AP_QUERY_PART) WITH FilteredQueries AS ( SELECT QUERY_ID, QUERY_TEXT FROM TABLE(information_schema.query_history_by_warehouse(END_TIME_RANGE_START=>to_timestamp_ltz('${completed_time}'),RESULT_LIMIT => 10000)) WHERE QUERY_TEXT NOT LIKE 'CREATE%' ) SELECT QUERY_ID, QUERY_TEXT, AP_TYPE, POS, STATUS, STATUS_MSG, AP_QUERY_PART FROM FilteredQueries f, LATERAL FLOWHIGH_APP.CODE_SCHEMA.get_ap(f.QUERY_TEXT, true, false) a; `; } snowflake.execute({sqlText: insert_query}); return "Success"; $; |