SQL Parsing for PostgreSQL Table and Column Audit Logging
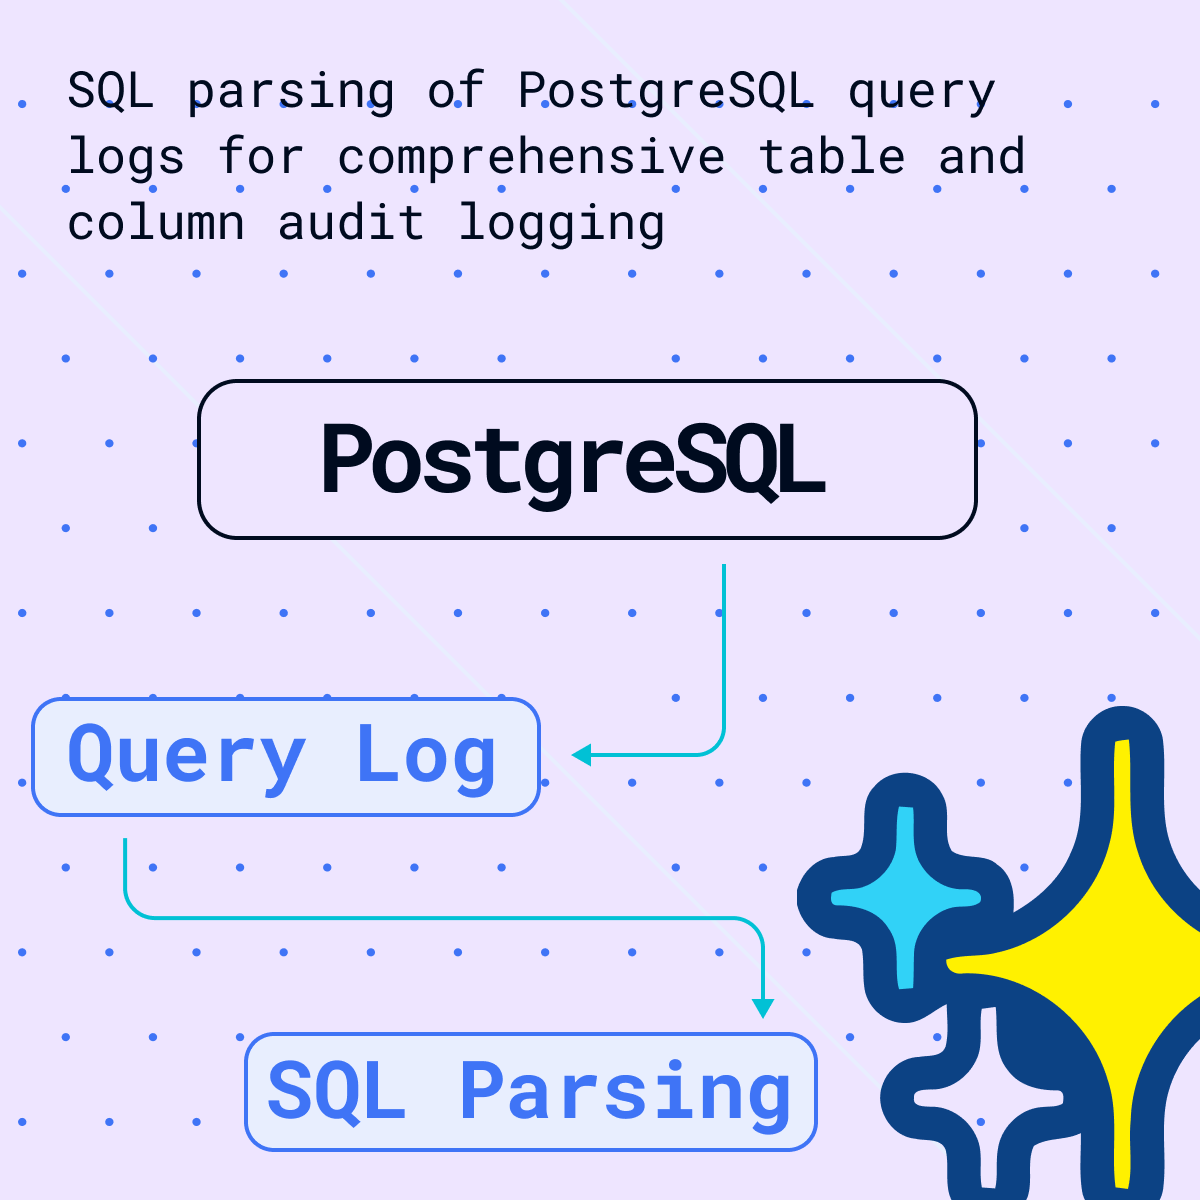
PostgreSQL, or Postgres, is an open-source object-relational database system known for its reliability, data integrity, and robust features. It offers advanced data types, comprehensive extensibility, and strong community support. Its ACID compliance ensures transactional reliability. PostgreSQL runs on various platforms, supports multiple programming languages, and includes features for replication, high availability, and security, making it suitable for everything from small applications to large-scale data warehousing.
PostgreSQL itself doesn’t provide a built-in feature specifically for query history, but it allows you to access this information through log files. Find the postgresql.conf file in the PostgreSQL directory. Once located, you’ll need to modify it to enable the logging of queries. Adjust the following settings as specified;
NOTE: Enabling log_statement = 'all' in PostgreSQL logs every SQL query, creating overhead. This impacts performance due to increased disk I/O, higher CPU usage, and rapid log file growth. While useful for debugging or auditing, it’s not recommended for high-load production environments due to significant performance implications.
log_destination = Set ‘stderr’ to direct the log output to the standard error stream.
log_directory = Set to desired directory.
log_statements: Set to ‘all’ to log all the statements and messages.
logging_collector: Turned on to start the logging collector, a background process that captures the server’s error messages and redirects them into log files.
log_connections = Enabled to log all successful connection attempts.
log_duration = Enabled to log the duration of each completed SQL command.
log_hostname = Enabled to log the host name of the connecting frontend.
After setting the configurations, restart the Postgres service and run the queries. The queries ran will be in the log file in the specified folder, here the log files are now in ‘newlog’.
NOTE: If you only want to log queries which run longer, then you can use ‘log_min_duration_statement’ instead of ‘log_statement=all’ which when set to specified value like 250 only logs all SQL statements that run 250ms or longer.
Using Python script to retrieve and filter out the user queries from log file
The log file contains user queries including backend queries performed by PostgreSQL. These are filtered out to get the queries performed by the user. As there was no differentiation between user query and backend system query, a customized python script was used to filter out the results. This might not work in filtering out exact user queries from other log files. Following python script was implemented.
|
1 2 3 4 5 6 7 8 9 10 11 12 13 14 15 16 17 18 19 20 21 22 23 24 25 26 27 28 29 30 31 32 33 34 35 36 37 38 39 40 41 |
import re # Path to the log file log_file_path = '/home/sonra/Desktop/log' # Define the pattern to match log entries with SQL statements log_entry_pattern = r"\d{4}-\d{2}-\d{2} \d{2}:\d{2}:\d{2}.\d{3} GMT \[\d+\] postgres@postgresclient backend0 LOG: statement: (.+)" # Define patterns to exclude specific backend or automated queries excluded_patterns = [ r"^SELECT version\(\)", r"^SELECT n\.nspname, r\.relname", r"^SELECT at\.attname, ty\.typname, at\.attnum", r"^SELECT at\.attname, at\.attnum, ty\.typname", r"^SELECT pg_cancel_backend(42457)" r"pg_catalog", r"pg_settings", r"/\*pga4dash\*/" ] # List to store user's queries user_queries = [] # Read the log file and extract the queries with open(log_file_path, 'r') as file: for line in file: # Check if the line contains a SQL statement match = re.search(log_entry_pattern, line) if match: # Extract the SQL statement sql_statement = match.group(1).strip() # Check if it matches any excluded patterns if not any(re.search(pattern, sql_statement, re.IGNORECASE) for pattern in excluded_patterns): user_queries.append(sql_statement) # Output the extracted queries print(user_queries) |
Analyzing the result of FlowHigh SQL parser
Now that we have the queries, this can be SQL parsed using FlowHigh SDK using the following script;
|
1 2 3 4 5 6 7 8 9 10 11 12 13 14 15 16 17 18 19 20 21 22 23 24 25 26 27 28 29 30 31 32 33 34 35 36 37 38 39 40 41 42 43 44 45 46 |
from flowhigh.utils.converter import FlowHighSubmissionClass import re # Path to the log file log_file_path = '/home/sonra/Desktop/log' # Define the pattern to match log entries with SQL statements log_entry_pattern = r"\d{4}-\d{2}-\d{2} \d{2}:\d{2}:\d{2}.\d{3} GMT \[\d+\] postgres@postgresclient backend0 LOG: statement: (.+)" # Define patterns to exclude specific backend or automated queries excluded_patterns = [ r"^SELECT version\(\)", r"^SELECT n\.nspname, r\.relname", r"^SELECT at\.attname, ty\.typname, at\.attnum", r"^SELECT at\.attname, at\.attnum, ty\.typname", r"^SELECT pg_cancel_backend(42457)", r"pg_catalog", r"pg_settings", r"/\*pga4dash\*/" ] # List to store user's queries user_queries = [] # Read the log file and extract the queries with open(log_file_path, 'r') as file: for line in file: # Check if the line contains a SQL statement match = re.search(log_entry_pattern, line) if match: # Extract the SQL statement sql_statement = match.group(1).strip() # Check if it matches any excluded patterns if not any(re.search(pattern, sql_statement, re.IGNORECASE) for pattern in excluded_patterns): user_queries.append(sql_statement) # Processing each SQL statement with FlowHighSubmissionClass for query in user_queries: fh = FlowHighSubmissionClass.from_sql(query) print(fh.json_message) # Output the result |
The FlowHigh SQL parser for PostgreSQL is designed to handle incoming SQL queries and convert them into either JSON or XML formats. When applied to the extracted query history, it generates a detailed representation of each SQL query, which includes information about filtering criteria, selected columns, used aliases, join conditions, involved tables, and various other SQL command components.
From the number of queries we ran, we can select the following query as an example.
|
1 2 3 4 5 6 7 8 9 10 11 12 13 14 15 |
SELECT e.employee_id ,e.employee_name ,d.department_name ,b.branch_name ,b.location ,e.salary FROM employee e JOIN department d ON e.department_id=d.department_id JOIN branch b ON e.branch_id=b.branch_id WHERE e.salary>50000 AND b.location LIKE '%New York%' ORDER BY e.salary DESC ,d.department_name |
Lets see how the XML/JSON conversion of FlowHigh works. Below is the XML output.
|
1 2 3 4 5 6 7 8 9 10 11 12 13 14 15 16 17 18 19 20 21 22 23 24 25 26 27 28 29 30 31 32 33 34 35 36 37 38 39 40 41 42 43 44 45 46 47 48 49 50 51 52 53 54 55 56 57 58 59 60 61 62 63 64 65 66 67 68 69 |
<?xml version='1.0' encoding='UTF-8'?> <parSeQL version="1.0" status="OK" ts="2023-12-05T00:29:02.570Z" xmlns:xsi="http://www.w3.org/2001/XMLSchema-instance" xsi:schemaLocation="https://flowhigh.sonra.io/flowhigh_v1.2.xsd"> <statements> <statement pos="0-305" cluster_top_Hi_ID="-1632967453198398694" cluster_top_Lo_ID="6913153026687168982" cluster_logical_ID="5255759056892301822" cluster_raw_ID="-5147523604319941958"> <ds pos="0-305" type="root" subType="inline"> <out> <attr pos="7-13" oref="C1"/> <attr pos="22-15" oref="C2"/> <attr pos="39-17" oref="C3"/> <attr pos="58-13" oref="C4"/> <attr pos="73-10" oref="C5"/> <attr pos="85-8" oref="C6"/> </out> <in> <ds pos="99-10" alias="E" oref="T1"/> <join type="inner" definedAs="explicit"> <ds pos="115-12" alias="D" oref="T2"/> <op pos="131-33" type="EQ"> <attr pos="131-15" oref="C7"/> <attr pos="149-15" oref="C8"/> </op> </join> <join type="inner" definedAs="explicit"> <ds pos="170-8" alias="B" oref="T3"/> <op pos="182-25" type="EQ"> <attr pos="182-11" oref="C9"/> <attr pos="196-11" oref="C10"/> </op> </join> </in> <filter xsi:type="filtreg"> <op pos="214-49" type="AND"> <op pos="214-16" type="GT"> <attr pos="214-8" oref="C6"/> <const>50000</const> </op> <op pos="235-28" type="LIKE"> <attr pos="235-10" oref="C5"/> <const>'%New York%'</const> </op> </op> </filter> <sort> <attr pos="273-8" direction="desc" oref="C6"/> <attr pos="288-17" direction="asc" oref="C3"/> </sort> </ds> <rawInput>SELECT e.employee_id, e.employee_name, d.department_name, b.branch_name, b.location, e.salary FROM employee e JOIN department d ON e.department_id = d.department_id JOIN branch b ON e.branch_id = b.branch_id WHERE e.salary > 50000 AND b.location LIKE '%New York%' ORDER BY e.salary DESC, d.department_name</rawInput> </statement> </statements> <DBOHier> <dbo oid="T1" type="TABLE" name="EMPLOYEE"> <dbo oid="C1" type="COLUMN" name="EMPLOYEE_ID"/> <dbo oid="C2" type="COLUMN" name="EMPLOYEE_NAME"/> <dbo oid="C6" type="COLUMN" name="SALARY"/> <dbo oid="C7" type="COLUMN" name="DEPARTMENT_ID"/> <dbo oid="C9" type="COLUMN" name="BRANCH_ID"/> </dbo> <dbo oid="T2" type="TABLE" name="DEPARTMENT"> <dbo oid="C3" type="COLUMN" name="DEPARTMENT_NAME"/> <dbo oid="C8" type="COLUMN" name="DEPARTMENT_ID"/> </dbo> <dbo oid="T3" type="TABLE" name="BRANCH"> <dbo oid="C4" type="COLUMN" name="BRANCH_NAME"/> <dbo oid="C5" type="COLUMN" name="LOCATION"/> <dbo oid="C10" type="COLUMN" name="BRANCH_ID"/> </dbo> </DBOHier> </parSeQL> |
Tables and Columns
From the XML output, we can easily identify the tables and columns of the query.
|
1 2 3 4 5 6 7 8 9 10 11 12 13 14 15 |
<dbo oid="T1" type="TABLE" name="EMPLOYEE"> <dbo oid="C1" type="COLUMN" name="EMPLOYEE_ID"/> <dbo oid="C2" type="COLUMN" name="EMPLOYEE_NAME"/> <dbo oid="C6" type="COLUMN" name="SALARY"/> <dbo oid="C7" type="COLUMN" name="DEPARTMENT_ID"/> <dbo oid="C9" type="COLUMN" name="BRANCH_ID"/> </dbo> <dbo oid="T2" type="TABLE" name="DEPARTMENT"> <dbo oid="C3" type="COLUMN" name="DEPARTMENT_NAME"/> <dbo oid="C8" type="COLUMN" name="DEPARTMENT_ID"/> </dbo> <dbo oid="T3" type="TABLE" name="BRANCH"> <dbo oid="C4" type="COLUMN" name="BRANCH_NAME"/> <dbo oid="C5" type="COLUMN" name="LOCATION"/> <dbo oid="C10" type="COLUMN" name="BRANCH_ID"/> |
We can see that tables involved in the query are ‘EMPLOYEE’, ‘DEPARTMENT’, ‘BRANCH’ and the columns involved are EMPLOYEE_ID, EMPLOYEE_NAME. SALARY,DEPARTMENT_ID, BRANCH_ID, DEPARTMENT_NAME, BRANCH_NAME AND LOCATION. The name of the schemas, tables, and columns can be found in the xml from the FH parser.
Joins
Joins can be easily identified using the <join> tag.
|
1 2 3 4 5 6 7 8 9 10 11 12 13 14 15 |
<ds pos="99-10" alias="E" oref="T1"/> <join type="inner" definedAs="explicit"> <ds pos="115-12" alias="D" oref="T2"/> <op pos="131-33" type="EQ"> <attr pos="131-15" oref="C7"/> <attr pos="149-15" oref="C8"/> </op> </join> <join type="inner" definedAs="explicit"> <ds pos="170-8" alias="B" oref="T3"/> <op pos="182-25" type="EQ"> <attr pos="182-11" oref="C9"/> <attr pos="196-11" oref="C10"/> </op> </join> |
By looking the XML output , we can find that there is an inner join between tables (join type) EMPLOYEE alias T1 and table DEPARTMENT alias T2 on c7 which is the DEPARTMENT_ID of EMPLOYEE table with c8 which is the DEPARTMENT_ID of DEPARTMENT table.
This is further joined with table BRANCH alias T3 on c9 which is BRANCH_ID of EMPLOYEE table with the c10 which is BRANCH_ID of BRANCH table.
The aliases can be found from the <DBOHier> section of the code.
Filter
Similarly filters used in the query can be identified from <filter xsi:type=”filtreg”> block of XML.
|
1 2 3 4 5 6 7 8 9 10 11 12 |
<filter xsi:type="filtreg"> <op pos="214-49" type="AND"> <op pos="214-16" type="GT"> <attr pos="214-8" oref="C6"/> <const>50000</const> </op> <op pos="235-28" type="LIKE"> <attr pos="235-10" oref="C5"/> <const>'%New York%'</const> </op> </op> </filter> |
From the code above, we can see that filters like ‘AND’ and ‘LIKE’ are referenced to C6 and C5 section of the code which are;
|
1 2 |
<dbo oid="C6" type="COLUMN" name="SALARY"/> <dbo oid="C5" type="COLUMN" name="LOCATION"/> |
And the matching criteria used is ‘%New York%’.
Order By
The Order by statement can be found by checking the sort section of the code <sort>.
|
1 2 3 4 |
<sort> <attr pos="273-8" direction="desc" oref="C6"/> <attr pos="288-17" direction="asc" oref="C3"/> </sort> |
Here we can see that for the C6 referenced part, the order by used is descending order and for the c3 section , the order by used is ascending order.
|
1 2 |
<dbo oid="C6" type="COLUMN" name="SALARY"/> <dbo oid="C3" type="COLUMN" name="DEPARTMENT_NAME"/> |
While PostgreSQL may not always provide granular details about specific tables and columns in a query, FlowHigh supplements this information. It not only identifies the tables and columns but also zeroes in on the columns involved in join operations.
In summary, leveraging PostgreSQL for query history retrieval and utilizing FlowHigh for parsing SQL into XML and JSON formats revolutionizes data analysis and management. This process not only saves time but also enhances the understanding of complex queries by breaking them down into more digestible formats. The ability to analyze filters, order by clauses, and other query components in a clear manner is invaluable for data professionals. FlowHigh stands out as a versatile tool, promising continued advancements in efficient database handling.
FlowHigh User Interface for SQL parsing
Effortlessly parse SQL queries using the FlowHigh web interface, known for its user-friendliness and simplicity. With just a few clicks, you can access the SDK section of FlowHigh to explore the intricacies of your queries, including a detailed list of tables involved. This feature, particularly the ‘Table List,’ enhances your understanding of the query’s structure and relationships, streamlining the process of managing and analyzing your SQL data efficiently.
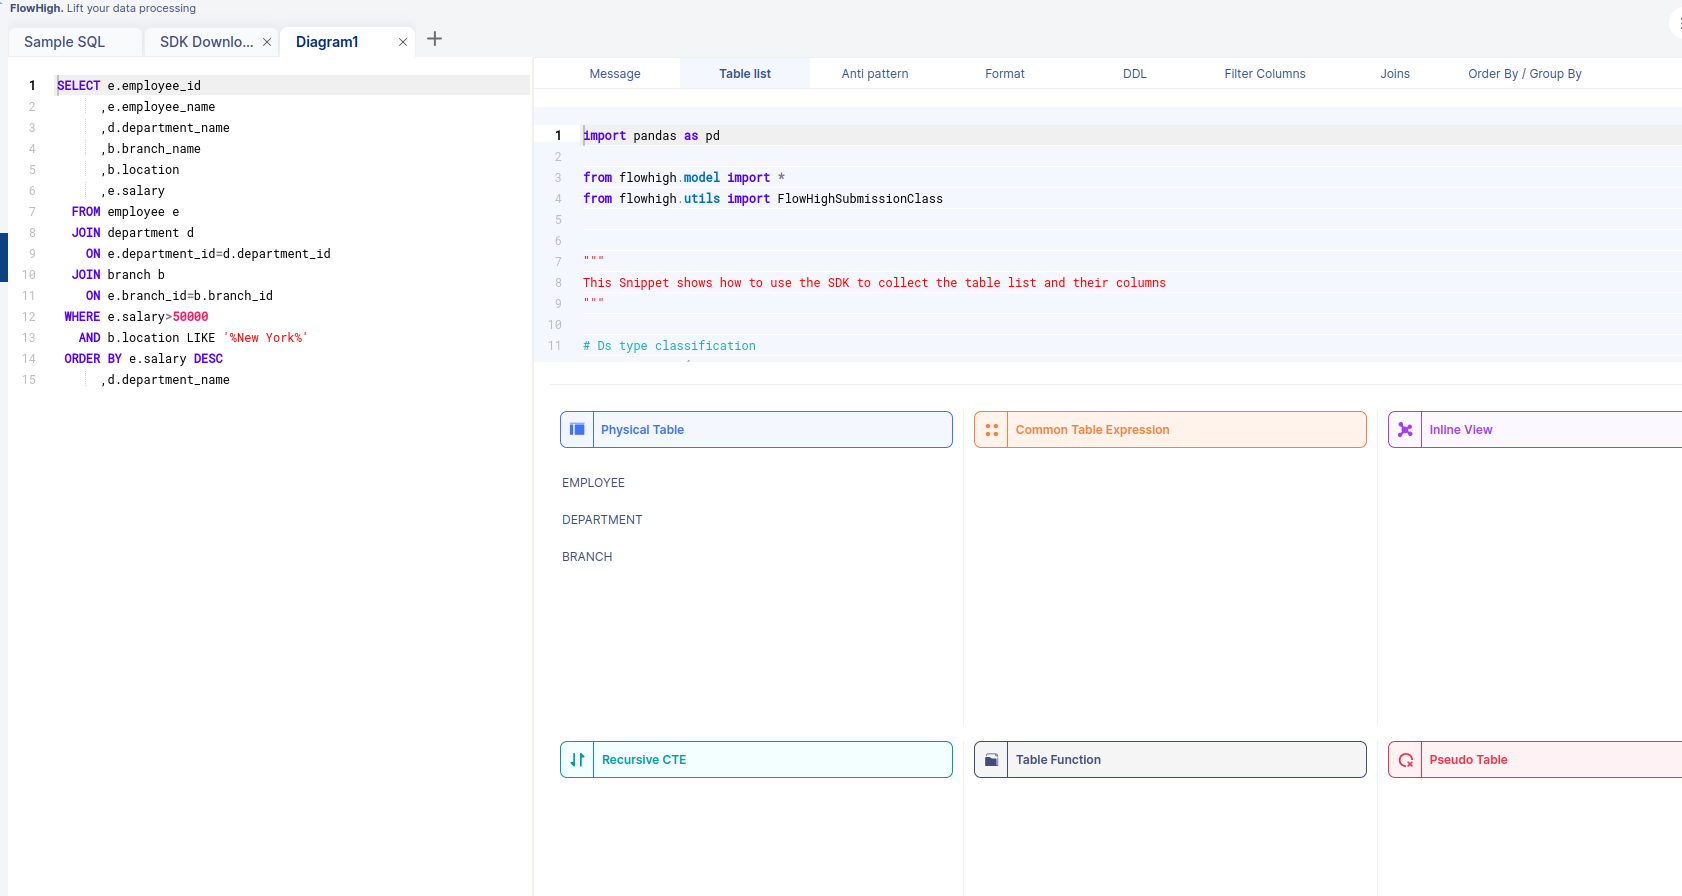
We can see that the tables used are EMPLOYEE, DEPARTMENT, and BRANCH. The other fascinating thing is that when we select a table from this, we can see the corresponding columns of that table.
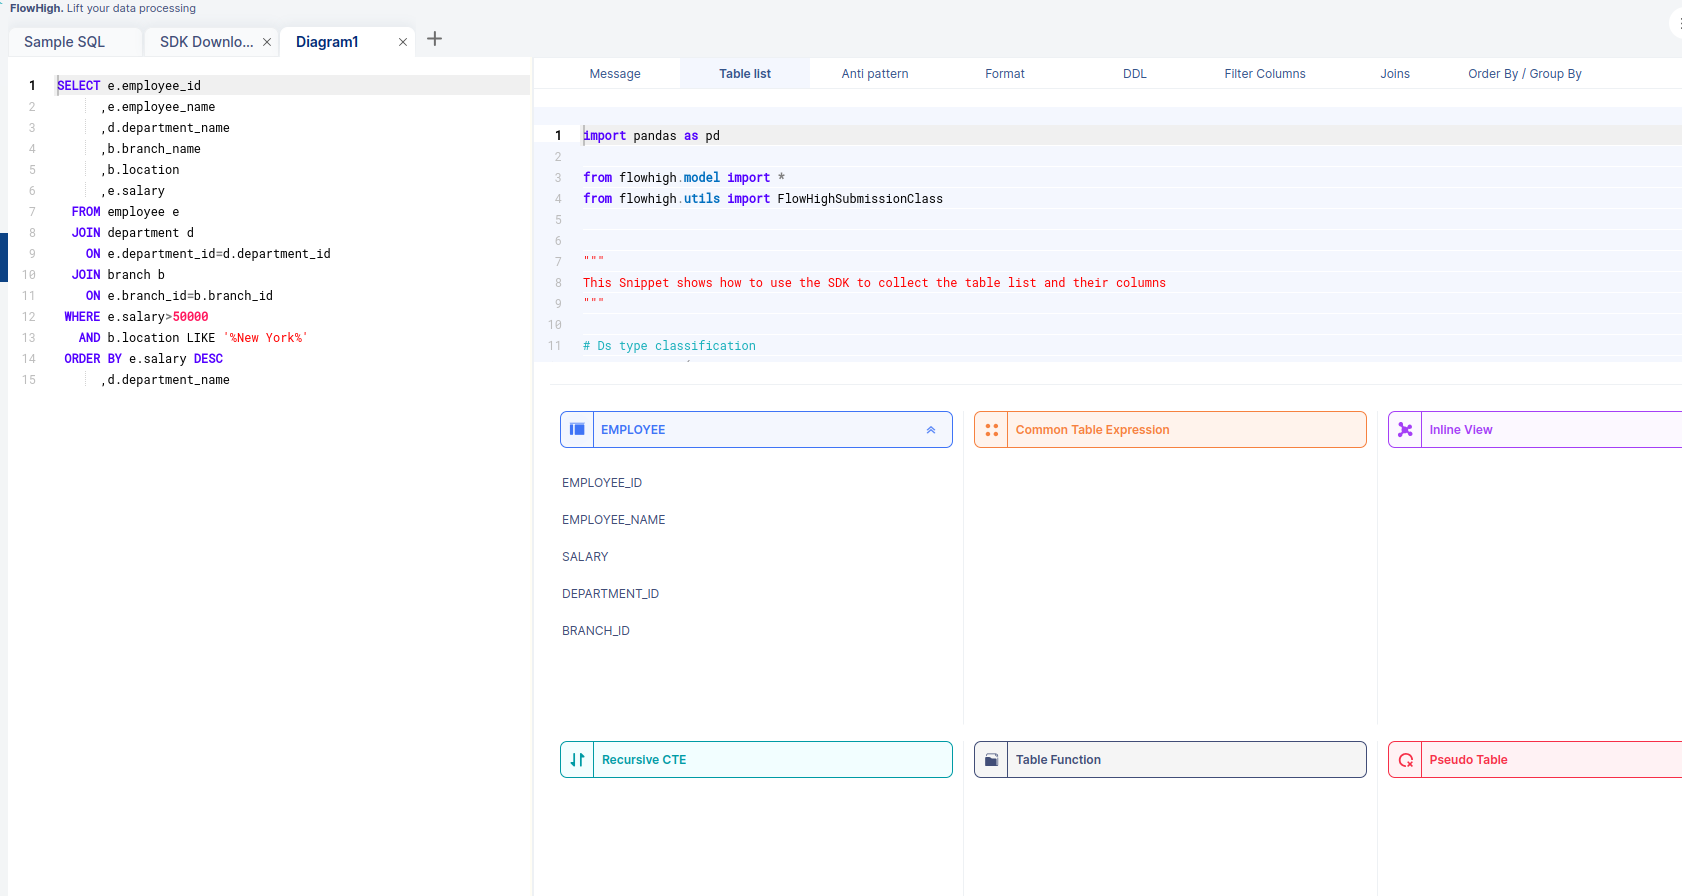
The above figure shows the columns of table EMPLOYEE.
Likewise, FlowHigh can be used to get columns used in a where conditions ,order by, group by and joins in the SQL query.
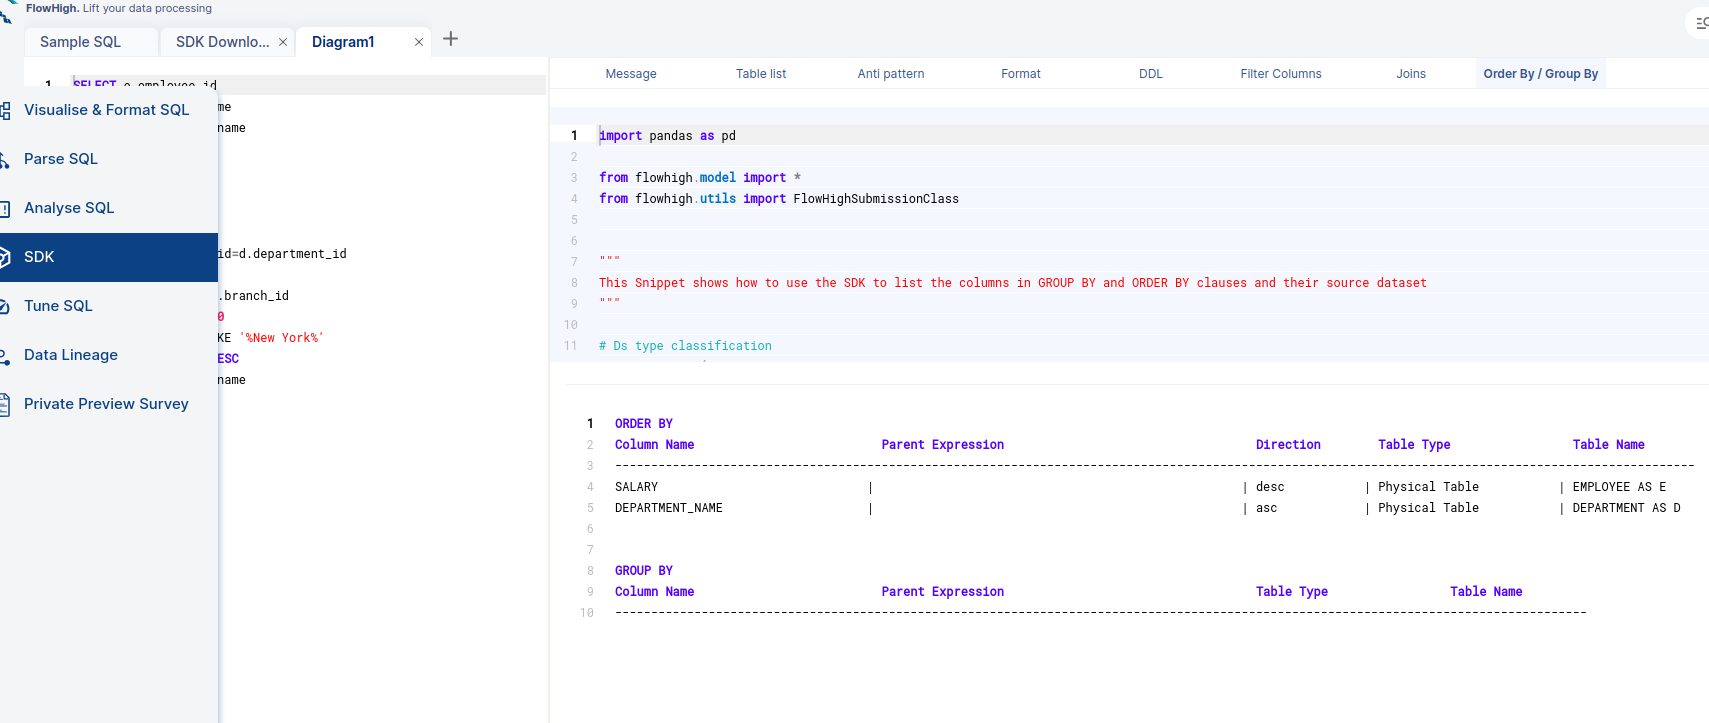
Columns used in GROUP BY / ORDER BY clause
FlowHigh can be used to filter out columns used in Group By/Order By clauses which is depicted in the figure below.
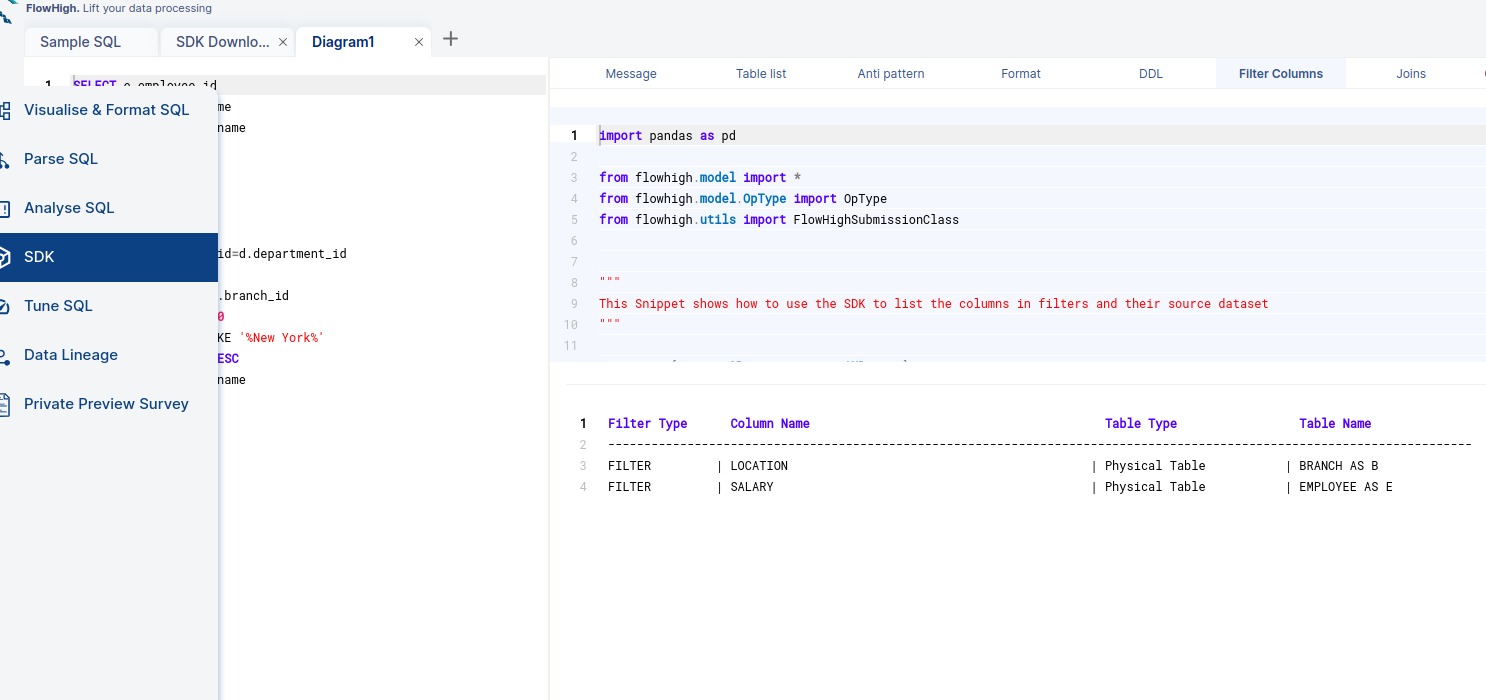
Filter Columns
Similarly, we can find the columns which are used as filters by clicking on the Filter Columns tab.
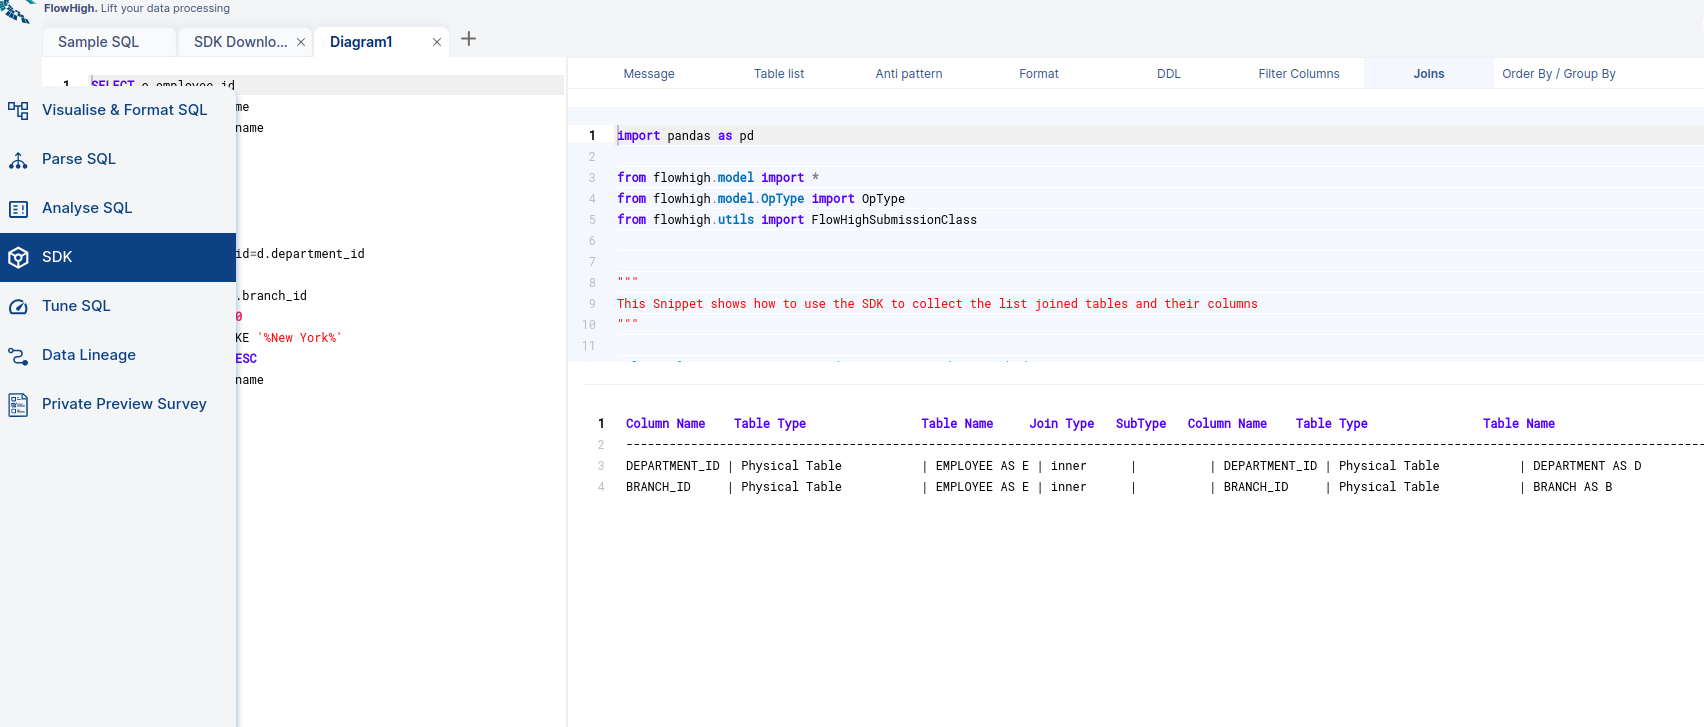
Columns used in Join Conditions.
By selecting the joins tab, we can see the columns we used for join conditions. It will filter out the columns of our query which are used for join conditions.
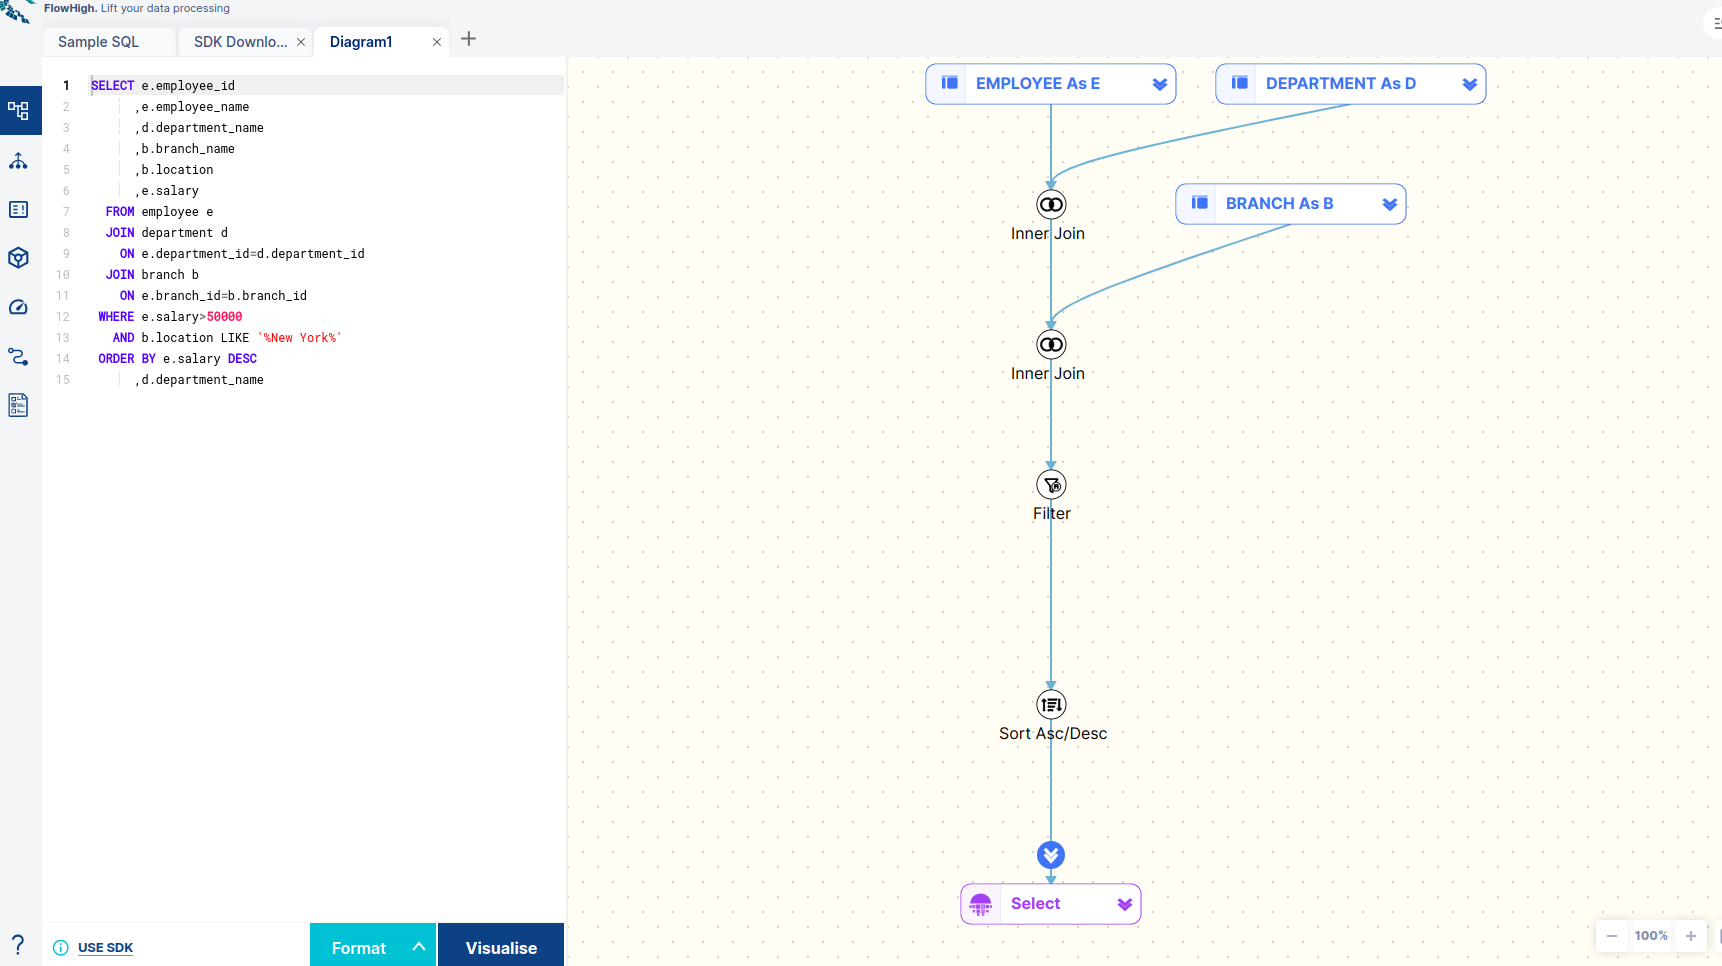
Visualize and Format SQL
Visualizing SQL queries helps understand complex queries. It lets developers see how each part of the query contributes to the final result, making it easier to understand and debug.
Properly formatting SQL queries enhances readability, simplifies debugging, and improves maintainability, enabling efficient collaboration and easier understanding of complex database interactions.
FlowHigh offers both ‘Format SQL’ and ‘Visualize SQL’ features, which effectively format and graphically represent SQL queries for enhanced clarity and understanding.
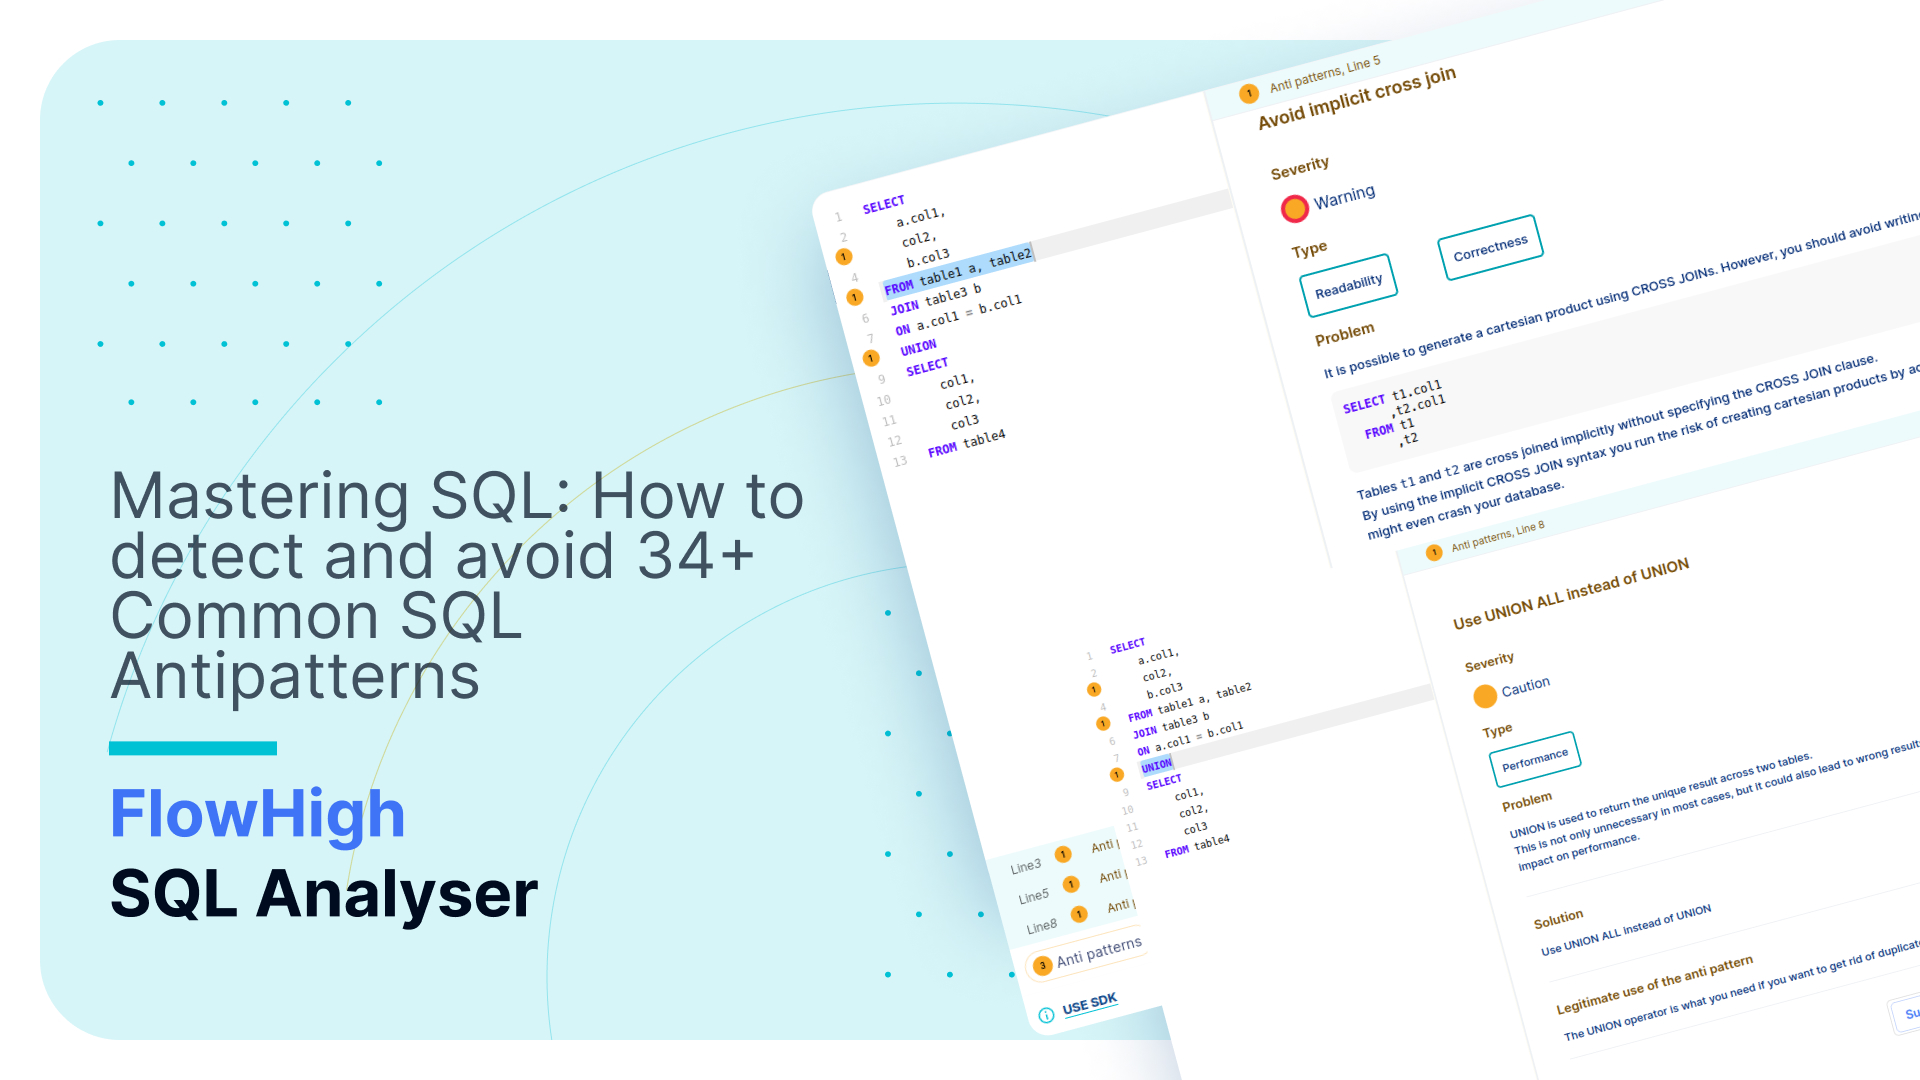
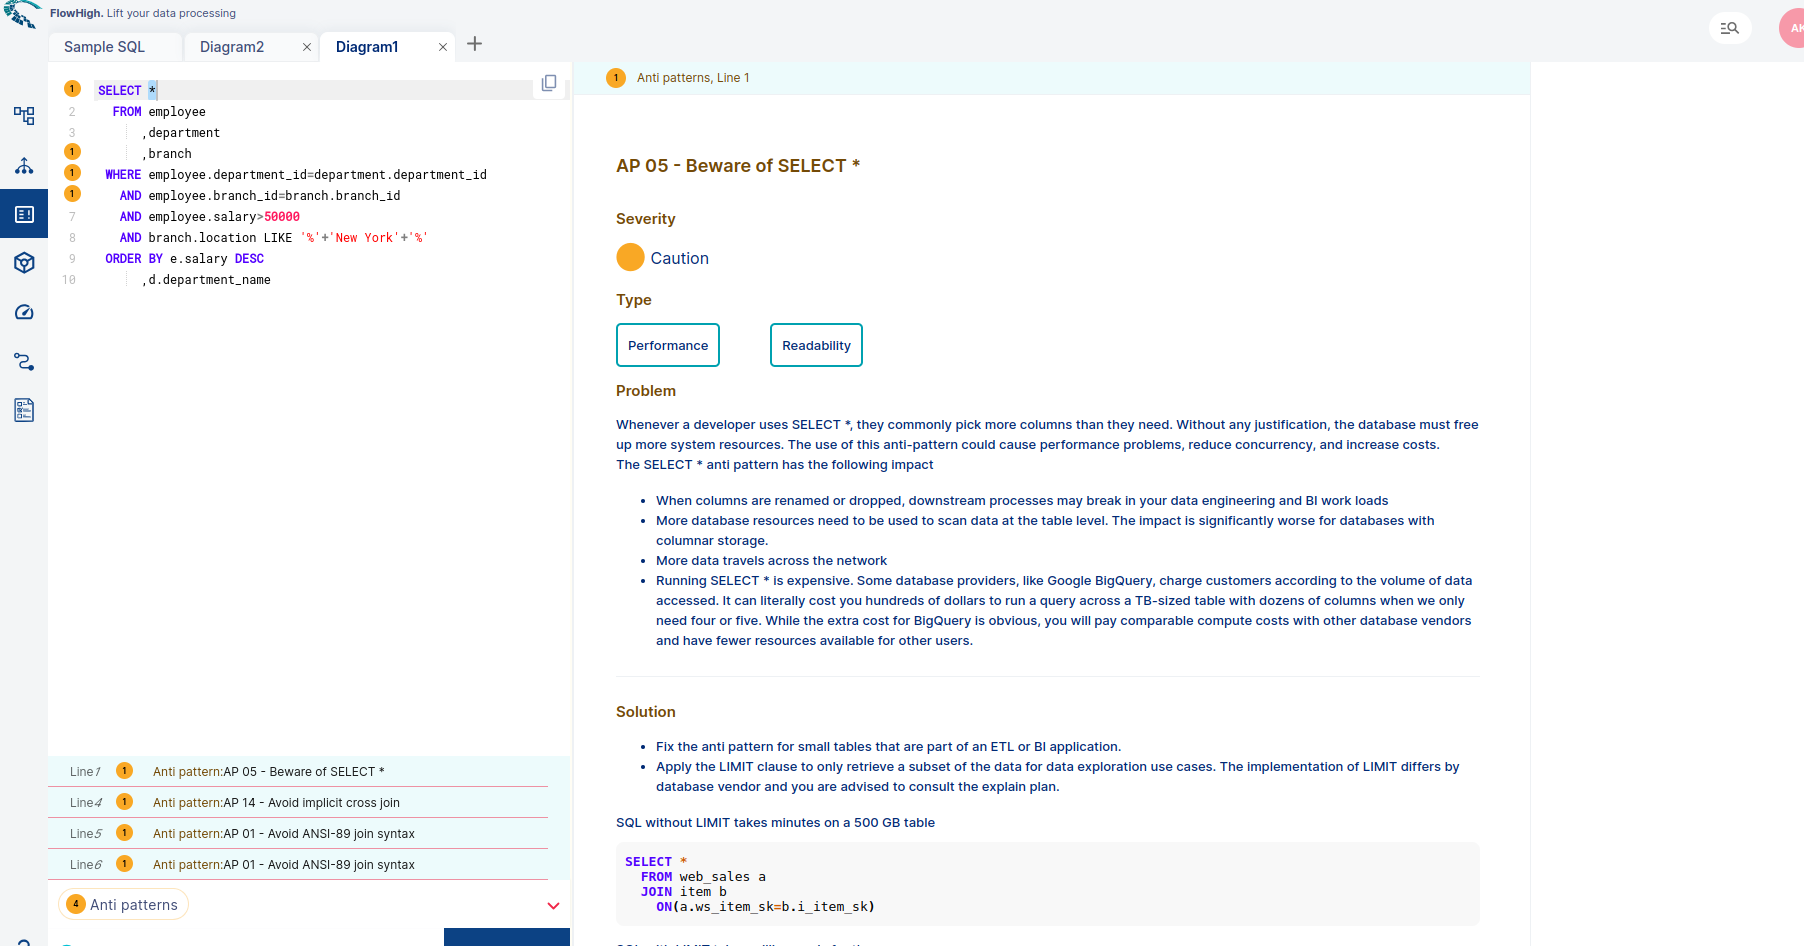
FlowHigh SQL Analyser
FlowHigh ships with a module named FlowHigh SQL Analyser which suggests methods to optimize the query by checking for Antipatterns and possible suggestions.
Following is our SQL query and the antipatterns found by FlowHigh.
You can try FlowHigh yourself. Register for FlowHigh.