What are the Benefits of Graph Databases in Data Warehousing?

Use Flexter to turn XML and JSON into Valuable Insights
- 100% Automation
- 0% Coding
RDBMS and Graphs
Relational databases are the work horse for storing and processing data. They are the poster boy of the data industry and have been going strong for almost 40 years. I can’t think of many other technologies that have stood the test of time for such an extensive period. The RDBMS can satisfy a vastly diverse set of use cases. They have been used for OLTP, BI/OLAP, ETL, Advanced Analytics, and yes, even Graphs.

What is a Graph?
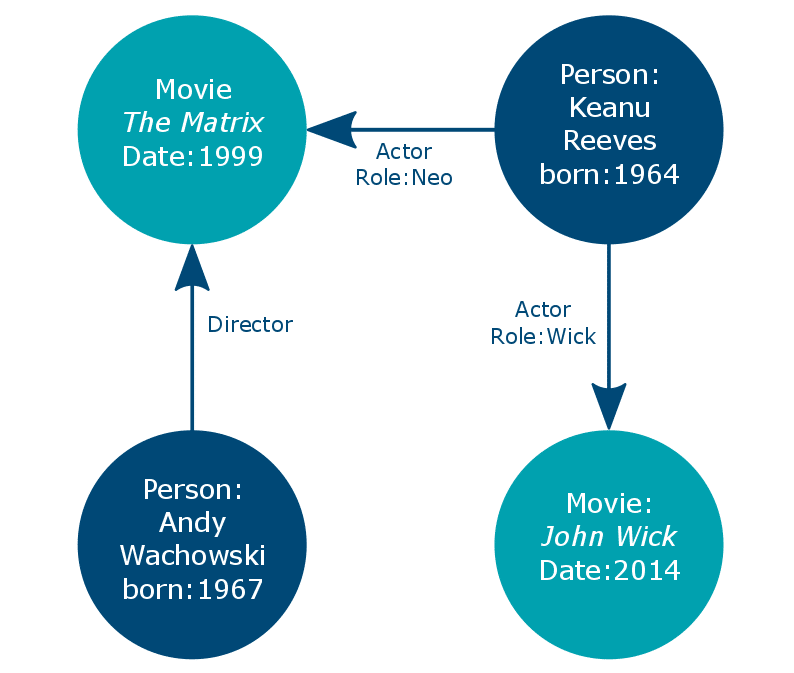
A graph is a collection of objects that are related with each other. The objects are called vertices (also referred to as nodes) and the relationships between them are called edges. If your data architecture model mainly consists of many-to-many (M:N) relationships or is highly hierarchical with multiple roots, an uneven number of levels (ragged hierarchies), a variable number of levels, or cyclical relationships you are likely dealing with a graph model. The social graphs in Twitter or LinkedIn or the web graph of hyperlinked web pages are some popular graph models.
Directed Graph Example
In a directed graph the relationship between nodes is unidirectional. Twitter implements a directed graph model. If someone follows me I don’t have to follow them back. Affection is another good example for a directed graph. Person A loves Person B but the love is not reciprocated. Another good example would be an explain plain generated by a query optimizer in a database. The plan flows in one direction from left to right.
Below is a screenshot of an explain plain of the PostgreSQL optimizer.
Undirected Graph Example
In an undirected graph there is no direction that the graph follows. LinkedIn or Facebook connections are a good example. They are mutual relationships.
RDBMS Graph Limitations
The data model
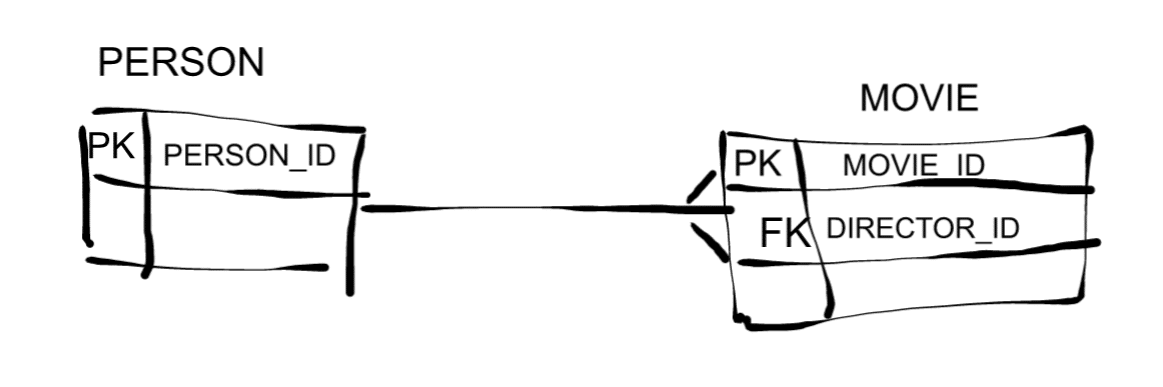
With a relational database we can model and query a graph by using foreign keys and self-joins. Just because RDBMS’ contain the word relational does not mean that they are good at handling relationships. The word relational in RDBMS stems from relational algebra and not from relationship. In an RDBMS, the relationship itself does not exist as an object in its own right. It either needs to be represented explicitly as a foreign key or implicitly as a value in a link table (when using a generic/universal modelling approach). Links between data sets are stored in the data itself. Let me give an example for the two scenarios.
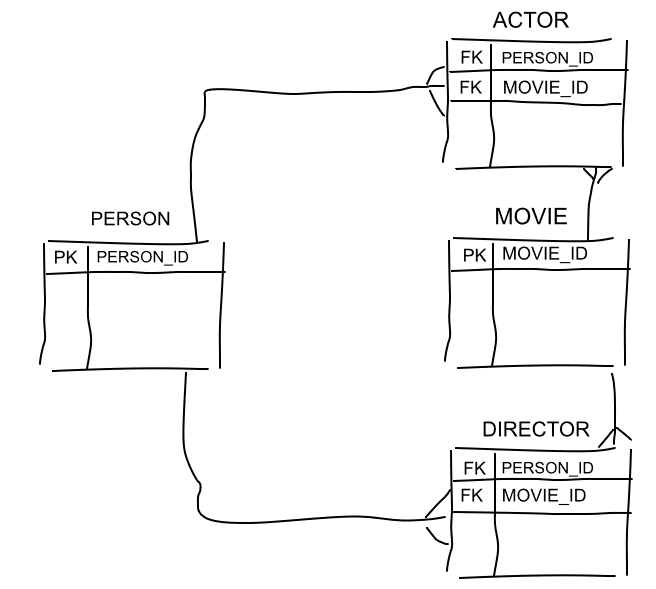
Example 1: The relationship between Person and Movie is encoded in table DIRECTOR through foreign keys.
We can model the above relationships more generically. This has the advantage of reducing the number of tables in our model. It also makes the model more flexible and more resilient to change, e.g. it will be easy to add another role value to the ROLE table just by using DML, e.g. Camera or Soundtrack. This advantage comes at the cost of readability. The different roles are obfuscated inside the ROLE table itself. We will lose information of the possible roles just by looking at the model. One approach to get around the readability issue would be to use the first model as our logical model and the second one just as the physical implementation of the model. This can be done in modelling tools.
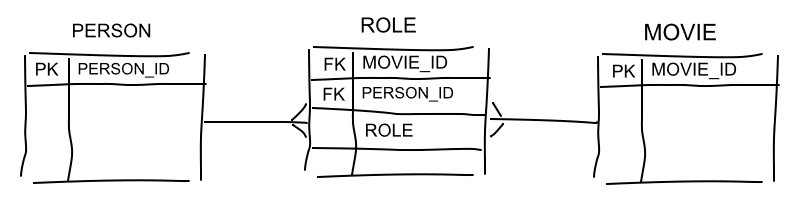
We don’t have any such problems in a graph database as we get the best of both worlds: Flexibility and readability.
Example taken from the excellent book Next Generation Databases by Guy Harrison.
My training course Big Data and Cloud for Data Warehouse and Business Intelligence professionals shows in detail how graph databases and big data technologies can address shortcomings of relational databases for data warehousing.
Performance – Traversal of data model
The more we increase the search depth in a query the more self-joins we need to perform and the more our query performance suffers, e.g. to find the actors that have co-starred with Keanu Reeves we need to join five tables. The deeper we go in our hierarchy the more tables we need to join and the slower our query gets. Mathematically the cost grows exponentially in a relational database. In other words the more complex our queries and relationships get the more we benefit from a graph versus a relational database. We don’t have performance problems in a graph database when navigating the graph. This is because a graph database stores the relationships as separate objects. However, the superior read performance comes at the cost of slower writes. No free lunch then.
SQL
SQL is not an ideal language for the things we typically do in a graph, e.g. if we need to traverse the graph to an arbitrary or variable depth in the hierarchy we have to write huge SQL statements. Graph databases come with their own query language that make this a lot easier. We will be covering the various query languages further down in the post.
Flexibility in Model
In certain situations it is easier to change the data model in a graph database than it is in an RDBMS, e.g. let’s look again at the Movies data model. Rather than modelling the Director to Movie role in a M:N relationship Person – Director – Movie we could have started the model as a 1:N relationship of Person – Movie.
This initial model is based on the business rule that a movie only ever has one director. What happens if this business rule changes, e.g. if we introduce the concept of a co-director? In a relational database we need to change the model, which involves creating a new table and performing row migrations. In the graph database we just add another edge and node. Simple as that. Please note that the RDBMS only has this problem in case we change from 1:1 to 1:N or from 1:N to M:N. For this reason proponents of the data vault modelling approach model all relationships as M:N. This makes the model more resilient to change at the cost of losing important information. Once again we can follow the approach of modelling the correct relationship in our logical model and the implementing it as an M:N relationship in the physical model.
The other flexibility we have in a graph database is that it handles sparse data much more naturally than a relational database. Clinical trials are a very good example for a sparse data set. A clinical trial has hundreds or even thousands of attributes and only a small subset of these properties overlap across trials. In a relational database we could get a lot of columns with NULL values as a result, which makes it harder to read the model.
Graph Databases
Graph databases address the shortcomings of relational databases for modelling and querying complex relationships. As we already discussed, they treat relationships as a separate object to achieve very good performance and increase the readability of the model.
Types of Storage
Graph databases tend to opt for one of two storage models. A model that uses doubly linked lists to store data and a model that stores the data in an adjacency list. The wide table approach found in BigTable, HBase, Cassandra is a good fit for the latter approach. Let’s do a quick comparison of the two approaches.
Doubly Linked Lists
Neo4J is an example for a graph database that stores its data as a doubly linked list. They call this index free adjacency. No index lookups are required to traverse the graph.
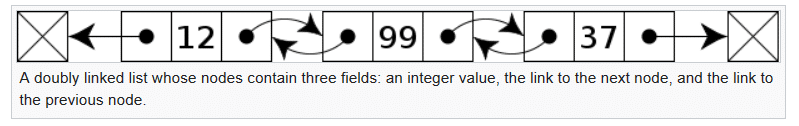
In this approach, graph traversal performance is independent of the size of the graph. However, write performance tends to be slower than with the adjacency list approach as we need to create additional structures.
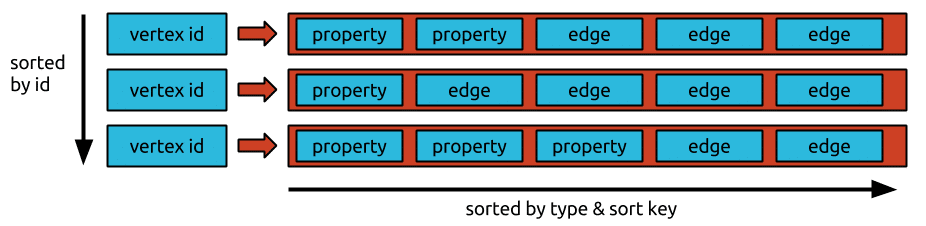
Adjacency list
Other graph databases such as Janus Graph (a fork of Titan DB) or the Oracle graph database have chosen a different storage format. They store the data in an adjacency list in a wide column store.
Each Vertex/Node stores first degree relationships/edges only in a contiguous area. This storage model uses a vertex centric index to speed up graph traversal.
The various trade-offs of storing the graph in an adjacency list are described in this insightful post, which also gives you a flavour of the various discussions that are going on between the various graph database camps.
Graph Query languages
As we have already noticed earlier on, SQL is not a good language for walking a graph. Hence the vendors of graph databases have come up with their own languages.
Cypher
Cypher is a declarative language comparable to SQL. Cypher was originally developed by Neo4J. They recently released an open source version of the query language as openCypher.
Gremlin
Gremlin is more similar to a full programming language.
I won’t go into any detail on how these query languages work and which one best fits your use case. This is not the objective of this post. There are articles that do a much better job at this.
Graph Analytics
It is important to draw a distinction between graph databases for transactions and graph processing for analytics. We know that relational databases can be used for transactional processing (OLTP) and business intelligence (BI/OLAP). In the relational world we typically use two separate types of relational databases for each use case. For transaction processing we use a highly normalized model with row based storage. For business intelligence we use a denormalized dimensional model with columnar compressed storage.
The most widely used graph algorithm is PageRank which underpins the search algorithm of the Google search engine. Graph theory is more than 250 years old and the origins go back to Leonhard Euler (Swiss mathematician) and the seven bridges of Königsberg.
In the world of graph databases we have a similar distinction. Transactional graph databases such as JanusGraph or Neo4J are used for transactional graph processing. We then have separate graph processing engines such as Spark’s Graph X or Flink’s Gelly. These engines ship with common graph algorithms that can calculate Page Rank, graph centrality, graph length, triangle counting etc. It is important to understand that graph analytics engines run their calculations as batch processes. They are not good for traversing or searching a graph. Transactional graph databases are good at looking at individual nodes and their relationships whereas graph analytics engines are good at looking at the overall graph and considering all nodes.
Graphs in Data Warehousing
That was a lot of theory and background information. At this stage you are probably wondering ‘What is the value of all of this stuff for my data warehouse’? What are some common graph use cases for data warehousing?
Data Orchestration is a Graph Problem
If your data warehouse is of a medium to large size you will probably have thousands of data flows that depend on each other and need to be orchestrated for execution. This dependency chain is nothing else but a Directed Acyclic Graph.
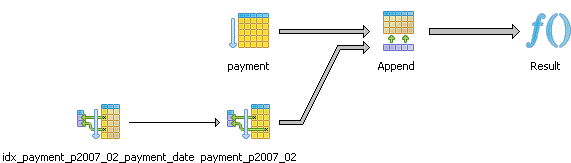
Below is a figure of a data orchestration graph generated via Apache Airflow, which is a brilliant data orchestration engine originally developed by AirBnB engineers.
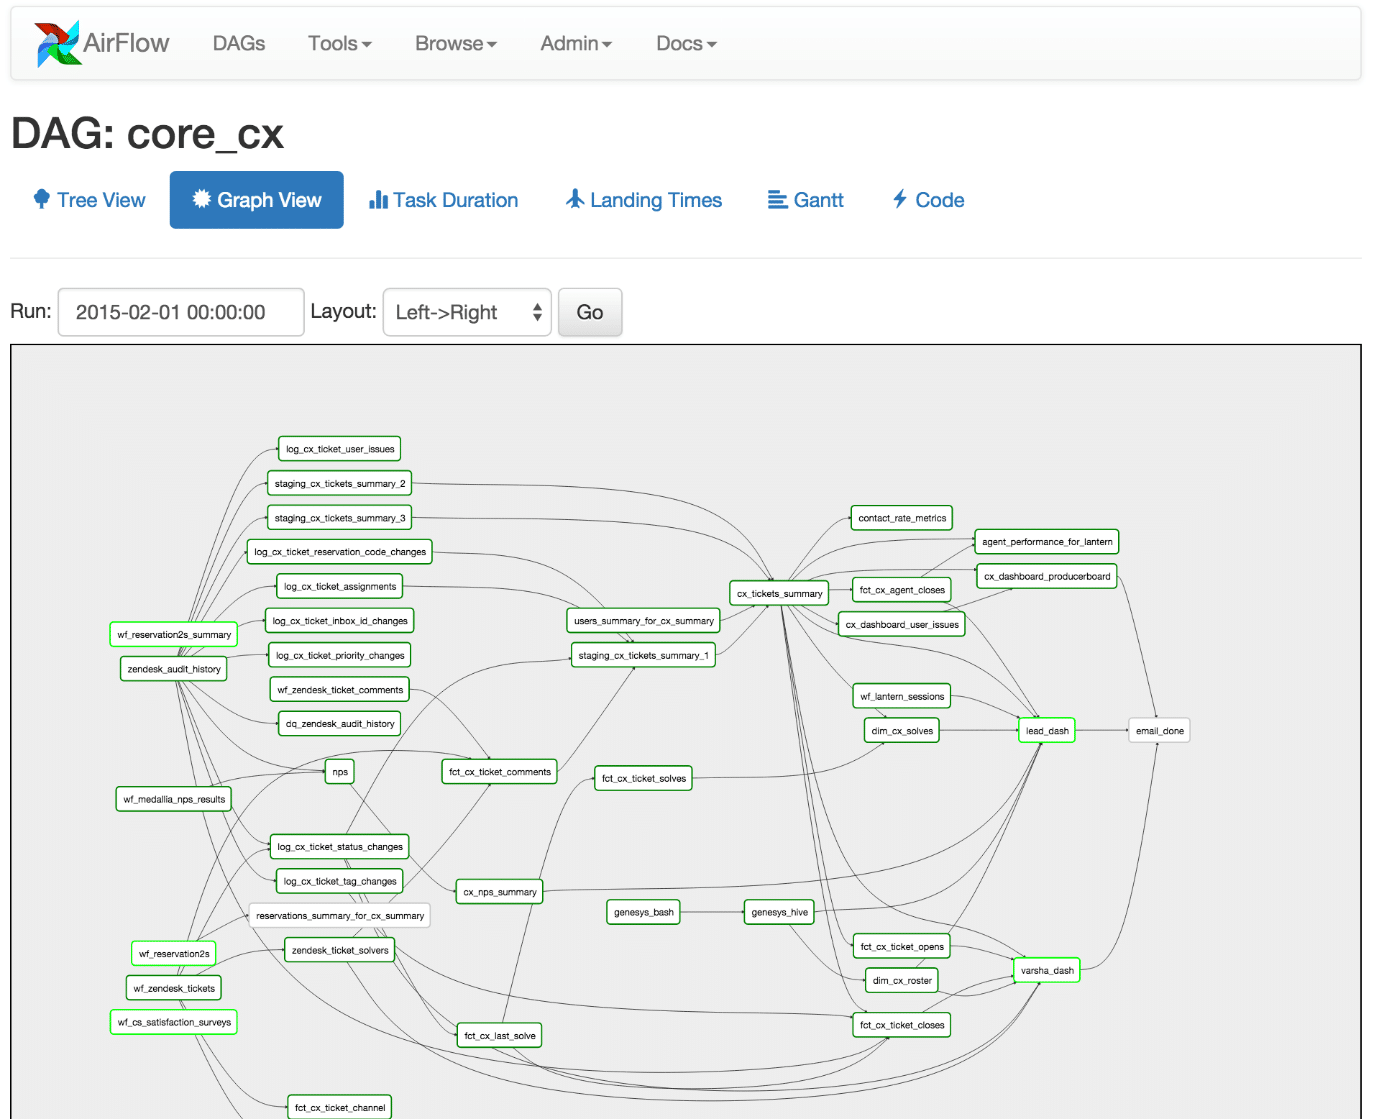
Once you understand that your data orchestration pipeline consists of a graph you can apply the various graph algorithms that will help you identify data flow nodes that lie on the critical execution path or represent super nodes with many outbound edges. In graph theory these super nodes are also known as hubs. By tuning the execution time of these critical nodes you can reduce the overall execution time of your data pipeline.
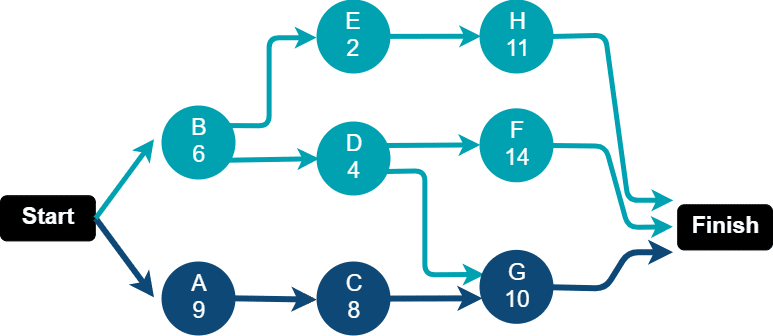
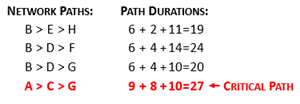
In the example below, we might intuitively think that by reducing the execution time of the longest running data flow we speed up the overall execution of the graph. However, to reduce the total execution time of the graph we need to reduce the execution time of data flows that lie on the critical path. In our case that is path A > C > G, which is the path with the longest execution time.
Data Lineage
Another use case for graphs in the data warehouse is data lineage. Once again we are dealing with a directed acyclic graph when looking at how data points flow from source systems through the various transformation steps and storage engines. Data lineage is part of the data management discipline and becomes more and more relevant from a compliance point of view, e.g. GDPR or BCBS 239 etc.
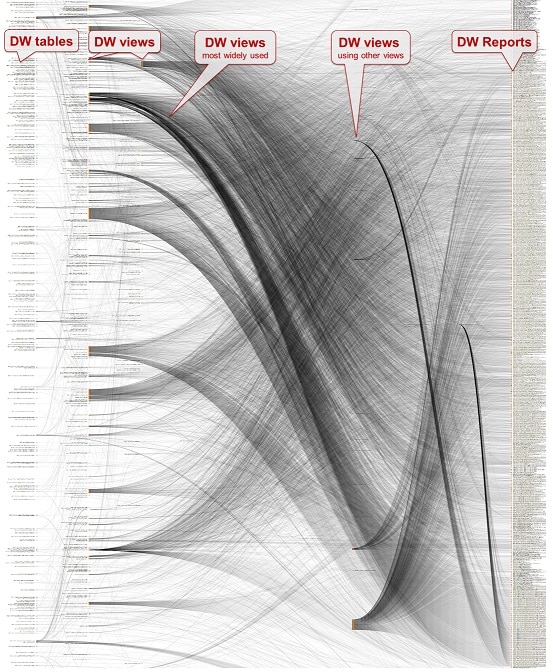
Image from dlineage.com website
Data Catalogue
Graphs are a great way of representing a company’s data assets in a data catalogue. As the name suggests, the data catalogue is similar to the catalogue in a library. It makes it easy to search and discover available data sets in the enterprise. Similar to the catalogue in a library it needs to be maintained and well looked after to be useful. Unlike a normal library catalogue the data catalogue may contain additional information, e.g. who uses the data sets, what is the data quality, does the data contain Personally Identifiable Information (PII) etc.
AirBnB, has implemented a data catalogue using graph and search technology (Neo4J graph database and Lucene/ES). The figure below is from a recent post by the AirBnB engineering team.
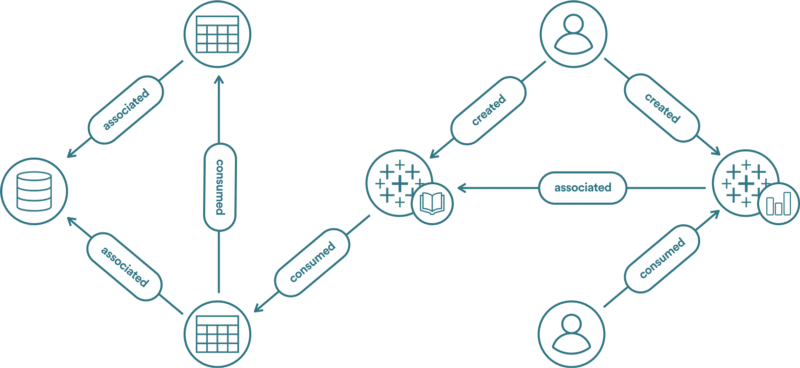
The AirBnB data catalogue graph represents data sources, data sets, data users, tools, and how these objects interact with each other, e.g. which data sets are consumed frequently or which users have expertise using a data set.
Master Data Management (MDM)
At the moment there is a big debate going on between vendors of traditional MDM solutions based on relational databases and the new kids on the block that promote the use of graph databases for MDM. The same pros and cons apply that we have already discussed. Graph databases are good at handling relationships. In MDM we are dealing with a lot of relationships and role playing entities. The same person can be a customer, supplier, employee, father, manager etc. Data sets from different sources tend to be sparse with some attributes stored in the CRM and others in the HR system. I have included two links to give you a flavour on the arguments that are exchanged between the various camps.
Does MDM need Graph?
Graph Databases in the Enterprise: Master Data Management
Data Vault
The data vault approach to data warehouse modelling is inspired by graph theory. It is an attempt to introduce relationships as separate objects into the data warehouse. All relationships between entities are modelled as many to many (M:N) relationships. The main motivation for doing so is to make the model more resilient to change rather than to speed up traversal of the nodes in the model. If you remember we discussed the lack of flexibility of the relational model when changing relationships between objects, e.g. a change from a 1:1 to a 1:N relationship will always require a costly DDL change of the model. By modelling all relationships as M:N the data vault approach to data warehouse modelling bypasses this issue.
My training course Big Data and Cloud for Data Warehouse and Business Intelligence professionals shows in detail how graph databases and big data technologies can address shortcomings of relational databases for data warehousing.
Graph Database Limitations
We now know the use cases where graph databases shine. Let’s look at some of their anti-patterns.
Graph Databases and Business Intelligence
Graph databases are definitely not a good fit for business intelligence and performance analytics. They just don’t do aggregations (well).
Graphs and Versioning Data
Graph databases are not a good fit for versioning data sets or keeping an audit trail of changes. Graph database vendors don’t have native support for time based versioning and the query languages don’t have built in support. Having said that there are some attempts to implement versioning on Neo4J.
Graph Databases Summary
So there you have it. Graph databases and the concept of graphs can add tremendous value to our data warehouse. Once you understand the basic concepts you will start to see graphs and graph like structures all around you. As the saying goes: if you just have a hammer everything looks like a nail (it’s actually more than a saying. It’s a law. The law of the instrument). Or translated to the data world, if you just have a relational database everything looks like a table. I hope that after reading this article you will also add a screwdriver to your toolkit and realise that sometimes a nail is actually a screw.
Uli Bethke
Uli has been rocking the data world since 2001. As the Co-founder of Sonra, the data liberation company, he’s on a mission to set data free. Uli doesn’t just talk the talk—he writes the books, leads the communities, and takes the stage as a conference speaker.
Any questions or comments for Uli? Connect with him on LinkedIn.
Follow Uli Bethke: