Data Warehouse 3.0. A Reference Architecture for the Modern Data Warehouse.

Use Flexter to turn XML and JSON into Valuable Insights
- 100% Automation
- 0% Coding
Reference data architecture for data management and analytics. An introduction.
I frequently come across data architecture diagrams that are riddled with vendor names, tools, and technologies. Tools and technologies have a place in data architecture but it is not a primary role. It is more of a support act than the main act.
First and foremost data architecture is abstracted from tools and technologies. This is what I call logical data architecture. It is purely conceptual and not tied to a particular tool, approach (e.g. ETL vs ELT), or technology. It is universal. You can translate the logical architecture into any combination of tools and technologies. A good architecture should be applicable to the cloud and on-premise. How and where you implement the architecture is important but a secondary concern.
Is this data architecture???
I call this secondary level of architecture the physical data architecture. It brings the logical architecture to life.
When we map the logical architecture to tools and vendors we need to take the context and requirements of each organisation into account.
The types of tools you select are highly dependent on your requirements, your organisation, the skills you have, preferences (e.g. build vs. buy), budget, existing vendor relations, software license model, skills and much more. One size does not fit all.
Some vendors and technologies will be a better fit for what you are trying to achieve than others. Often you will need multiple tools from multiple vendors to achieve your objectives. What tools you select is highly dependent on your requirements, your organisation, preferences (build vs buy), budget, skills and much more.
Let’s go through an example. Separating the conceptual architecture from the implementation details will prevent you from making silly statements such as “Hadoop will replace the data warehouse”. The data warehouse is a concept whereas Hadoop is a technology. You can implement a data warehouse on Hadoop but it does not make sense to say that a technology will replace a concept. I see this mistake being made frequently where people hear data warehouse and instinctively like a Pavlovian dog think relational database. There is no hard connection between the two.
Having said that some tools are unquestionably a better fit for certain use cases than others, e.g. while Hadoop is a good fit for processing unstructured data in batch (it was built for this purpose) it is a poor fit for BI style queries (even though it can be shoehorned to do so).
There are other aspects to implementing a successful data analytics solution: the operating model, the project management approach, governance, processes and standards, skills etc. While important we do not cover these areas as part of this blog post. My focus is on enterprise data architecture.
I should also say that the focus of this reference data architecture is for data analytics and data management use cases. It does not cover in detail various data integration scenarios and patterns such as Enterprise Application Integration.
FlowForward.
All Things Data Engineering
Straight to Your Inbox!
Logical architecture. First things first
At Sonra we have developed a reference enterprise data architecture over the years. It is bullet proof for the vast majority of data management use cases. If you are interested in our data architecture and data advisory services please contact us.
First I will walk you through our logical architecture. You won’t see any reference to tools or vendors. In a second step we then outline some of the Sonra core principles that we use when evaluating a tool or vendor. Finally we use the principles, apply them to the logical architecture and map it to the physical architecture where we talk about tools and vendors.
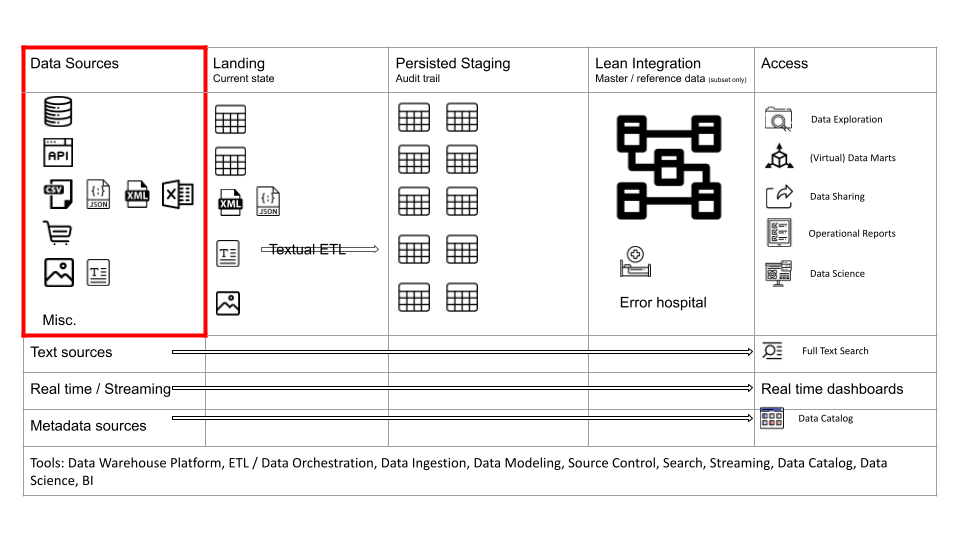
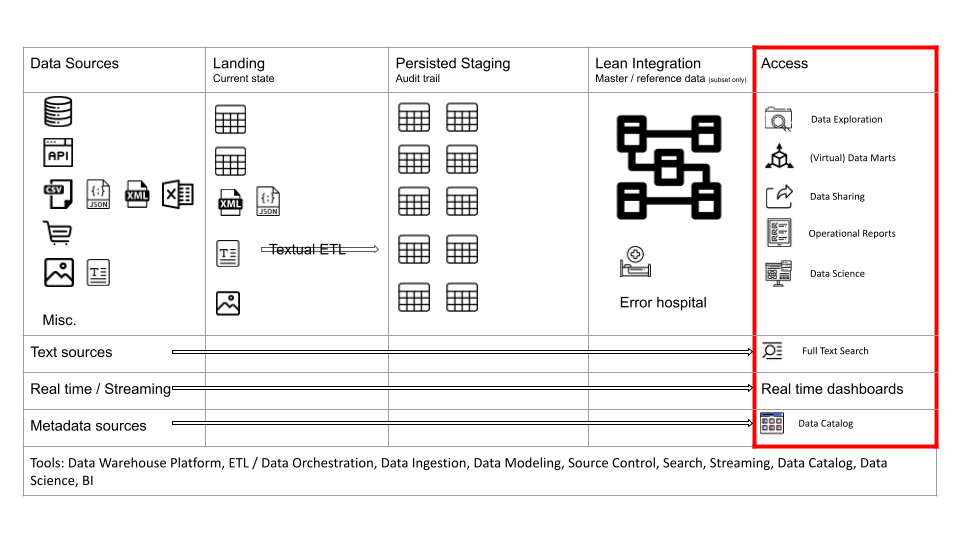
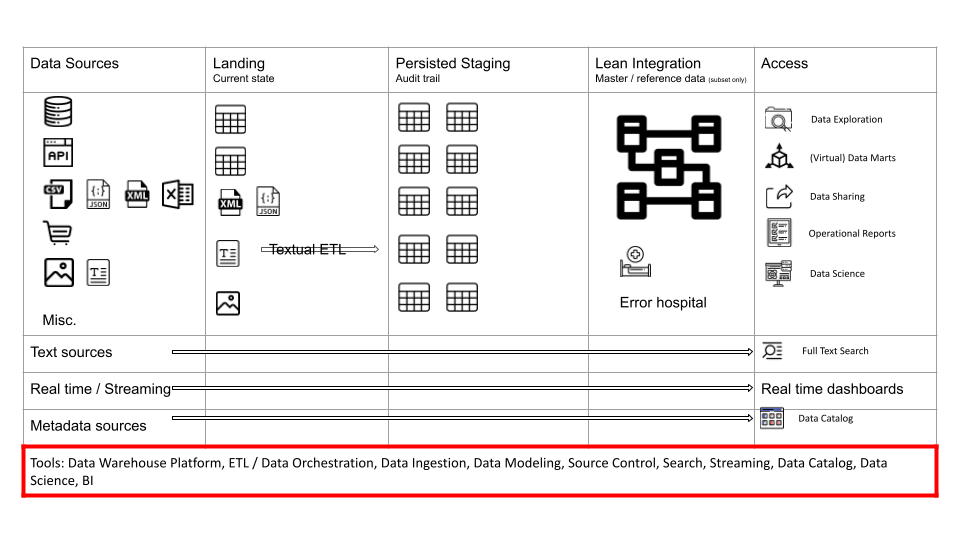
Let’s first have a look at the architecture diagram.
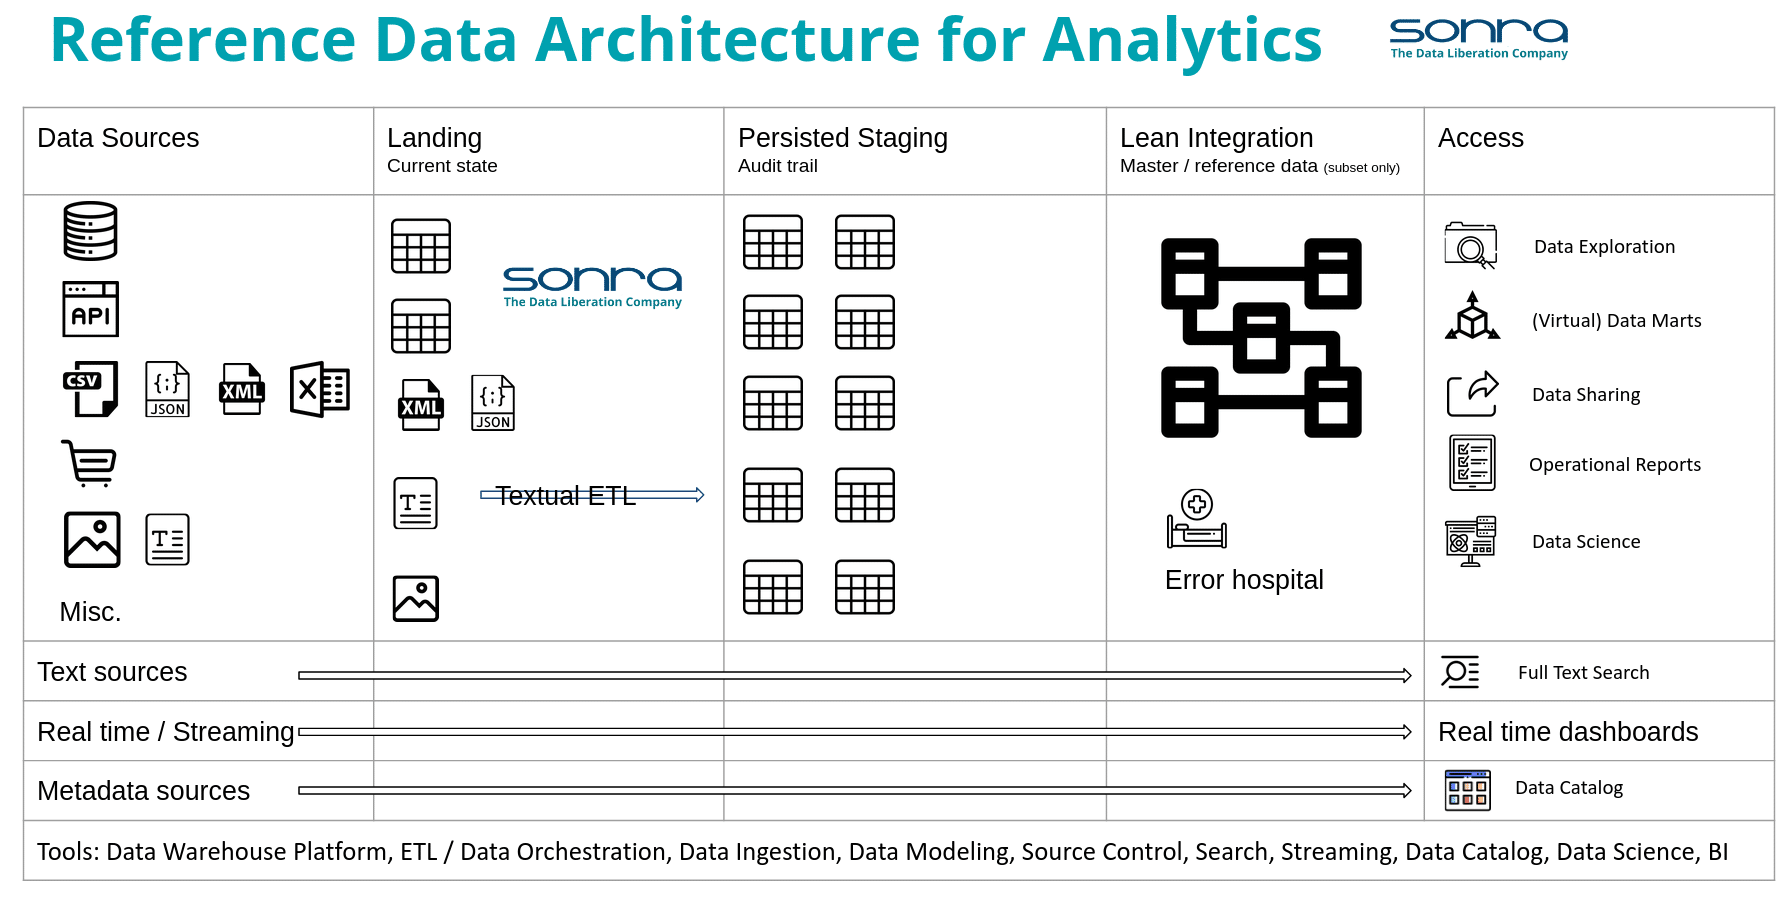
As you can see there are various vertical and horizontal layers. Let’s go through them in more detail.
Raw layer
The data sources are the operational systems of an organisation. They represent and store data that is generated through the business processes. 10-15 years ago most data sources for data analytics were relational databases and text files (usually exports from relational databases). This has changed significantly over the last few years and we need to cater for a variety of different data source types. We will look at these in more detail in a minute.
Let’s first zoom in on the Landing, and Persisted Staging layers as these are closely related. You can refer to them as the Raw layer in data architecture. We store the raw and unmodified data from the data sources.
Some people refer to this part of the data architecture as the data lake. The term data lake has a lot of negative connotations. It goes hand in hand with the term data swamp. I don’t think it is a good term to describe data architecture but it is now widely used (unfortunately).
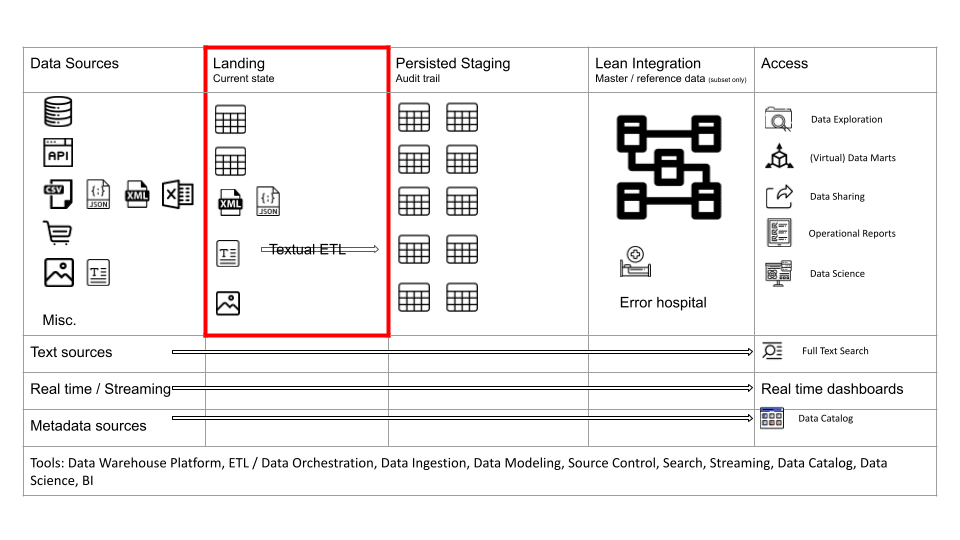
Landing
The Landing area is a copy of the data structures in your source systems. You should not apply transformations that contain business or integration logic between your sources and Landing. You may apply some soft transformations such as mapping of data types or adding of control columns such as processing timestamps, or column hashes. However, do not apply business transformation logic or table joins as part of data ingestion from source to Landing.
As a rule of thumb, it is better to ingest all the source data rather than just a subset, e.g. if you need to ingest a table to meet a requirement then ingest all the columns and not just a few columns. Reprocessing data and refactoring your data pipeline is expensive. Data storage on the other hand is cheap.
The Landing area loosely couples your data sources to your Staging area. It insulates the consumers of the Staging area from load failures.
The Landing area typically contains the current state of your source system. It typically does not store the history of changes aka data audit trail.
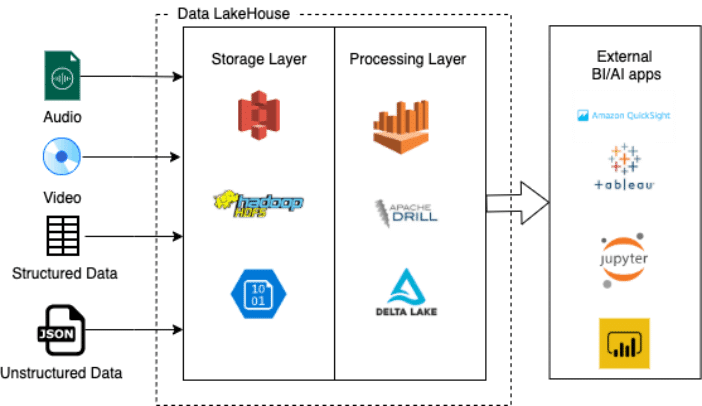
The Landing area is used to store all types of data. Structured, semi-structured, unstructured. Semi-structured and unstructured data is converted to structured data on the way from Landing to Staging.
You can use the Landing area to perform Change Data Capture (CDC) against Staging. CDC detects changes to source data, e.g. newly inserted, updated or deleted records. Various techniques exist to perform CDC.
- Reading the transaction log of a database.
- Using timestamps. We do not recommend this approach as it is not very reliable. It also requires a separate technique to detect deleted records. It may be useful under certain circumstances for very large transaction or event tables.
- Full extract and comparison between current state and previous state (as of last time the comparison took place)
CDC techniques depend on the type of source data, e.g. you will need to use a different technique for a text document or binary file than you would use for records in a relational database.
Persisted Staging
In early data warehouse implementations the Staging area was overwritten. Data was only stored permanently in the Integration and Data Mart layers. However, the Staging area has evolved over the last few years into the Persisted Staging area. Data is not overwritten. Quite the opposite. We store a full audit trail of historic changes to source data.
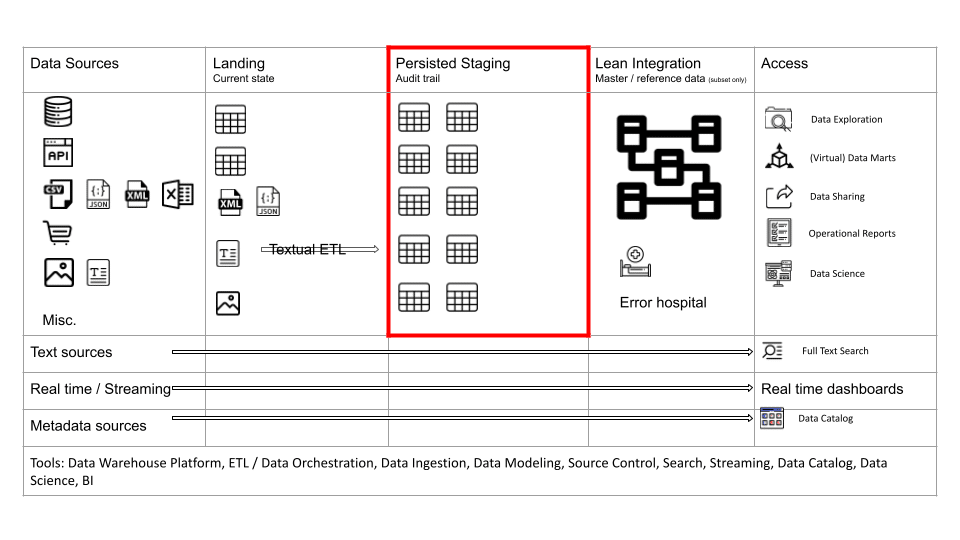
Furthermore, we can also keep any historic changes to the data structure itself, e.g. when a column is renamed you can keep both the original name and the new name. This is known as schema evolution or schema drift.
Storing a full audit trail and schema drift has significant benefits. You can run Point in Time queries that will tell you what your data looked like at any point in the past. You don’t have to take snapshots. Snapshots can be created dynamically from Persisted Staging. Using Persisted Staging you can rebuild, recreate or backfill your downstream models and layers. It is just a beautiful concept.
In the early days of data analytics, only data engineers and downstream processes accessed Staging. However, the Staging area has evolved significantly. Other consumers and processes now can access the Staging area. I will talk more about the various consumers of Staging when we talk about the Access layer.
Using metadata and configuration files, we can fully automate the process of loading the Landing and Staging layer. Using metadata we can also fully automate audit trail and schema drift.
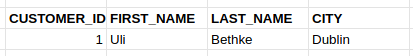
This is what an audit trail might look like in Persisted Staging for a Person table
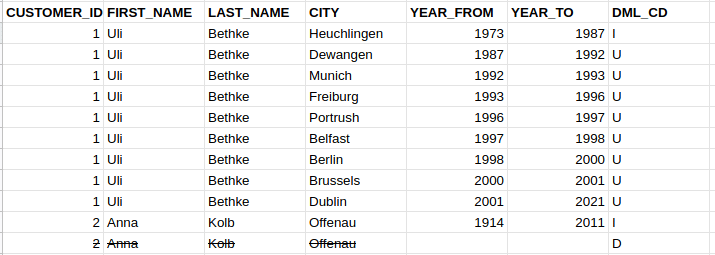
This is what the current state of the table would look like in the source system and Landing.
Data source types
Relational databases
The most common data source type is the relational database.
Databases are still at the heart of most business processes and transactions within an organisation. There are multiple ways of extracting data from relational databases
- Data exports via bulk load / unload utilities where the system owner pushes the data to the data teams.
- Direct connections that pull data over JDBC or ODBC
- Connections to the transaction log to extract the data in real time and with minimal impact on the database. This is also a pull model.
CSV, XML, JSON files
CSV or XML files are typically made available from third parties.
CSV files are also frequently made available as extracts from relational databases when the DBAs do not allow direct connections to the database.
You typically come across JSON documents as a type of source data when querying APIs or a NoSQL database such as MongoDB. Sometimes JSON is also used for data exchange scenarios.
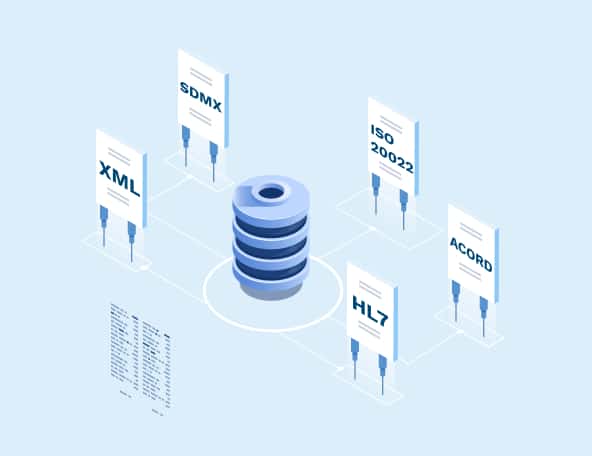
XML and JSON are so-called semi-structured data types. We recommend loading the XML / JSON documents to the Landing layer and then to convert them to structured tables on the way from Landing to Staging. For more complex JSON and XML documents, e.g. those based on industry data standards such as ACORD, HL7 etc., Sonra has created Flexter, an Enterprise XML Conversion tool. Flexter converts any XML to a readable and relational format in seconds.
Excel files
While there are certain valid scenarios for loading data from Excel it is often a symptom of a wider issue. Spreadsheets are used as a tactical and cheap substitute for proper operational systems. Strategically you should consider migrating these shadow IT systems built on Excel to a proper web application. Many low code or no code environments make it quick and easy to implement simple web applications, e.g. AWS Honeycomb.
SaaS (REST API)
Only a decade ago, APIs were a rare data source. With the rise of SaaS and cloud computing they are slowly but surely becoming the dominant data source replacing the relational database as the primary source. The dominant way of accessing data from SaaS is via APIs. I expect this to change in the future to set based via direct data sharing through relational style database tables. This is a much more scalable, much easier, and more secure way of exchanging data.
Data marketplace
A relatively new data source is the data marketplace. I have written elsewhere on this blog about the significance of the data marketplace for data architecture.
You can buy data from third parties to augment your own data. Data is made available as structured data. It is ready to be consumed. Sonra has made various open data sets available on the Snowflake data marketplace. We have published OpenStreetMap data for various countries and a universal geography dimension.
I will come back to the data marketplace in a minute when we talk about the Integration layer
Free text documents
Free text is locked away in various data formats, e.g. Office documents, databases, HTML pages, PDF files, analog documents etc. Usually we need to apply some pre-processing to get to its raw form. This may include Optical Character Recognition (OCR) for analog free text. This also applies to Audio. Audio is just a subtype of free text. It requires pre-processing in the form of transcription before it can be used for data analytics.
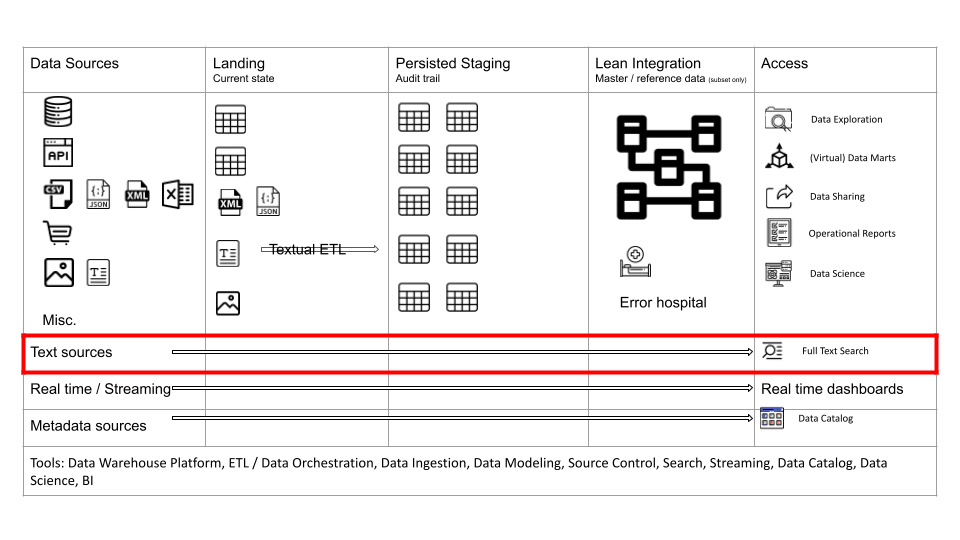
Text is frequently referred to as unstructured data. This is not entirely accurate. Text is governed by structures and rules. The structure is just complex and can be ambiguous.
How do we get text into our Staging area? It is quite simple, we impose structure on text and convert it to a structured format, e.g. by using techniques from textual ETL such as entity extraction. Once it is structured we can store it in a relational database. You can apply various techniques to extract value from free text.
- Keyword searching. We create an inverted index of the words in the text (similar to an index in a book) minus stop words and stemming. You can combine this with a company knowledge graph to build a sophisticated enterprise search engine.
- Machine Learning (ML), e.g. you can use entity extraction to extract core entities such as location, person, disease etc. Other examples of applying ML to text include sentiment analysis, text clustering/classification, summarisation and many more.
- Once you have extracted keywords you can combine the keywords or core concepts with an ontology or taxonomy. This way you can drill down or roll up on text documents.
Let’s go through a simple example.
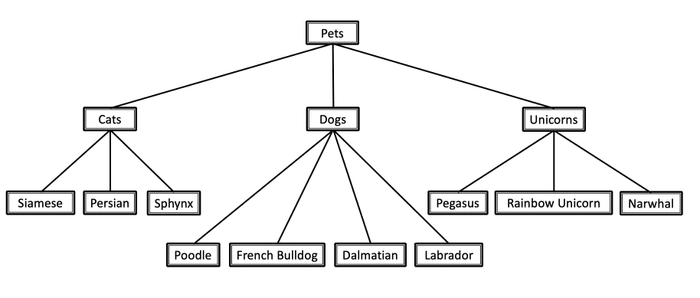
Let’s assume we have a text document with the keyword Poodle. Using a taxonomy we can locate the keyword Poodle in the taxonomy’s hierarchy. Dog is a parent of a poodle and a pet a grandparent. The words dog or pet may not appear in your document but using the taxonomy you will know that this document is about dogs and pets.
One of the main difficulties of dealing with text is to address ambiguities around the context of the text, which requires us to apply various techniques such as homograph resolution, proximity analysis, and negativity inference. Bill Inmon has written extensively about this topic in his books the Textual Warehouse and Turning Text into Gold.
Photos and images
You can use certain techniques from Machine Learning to extract information from photos and images such as the type of objects represented on the image. You can also extract metadata from images, e.g. the time it was created or the geo coordinates for the location of a photo.
What about audio and video? Audio to some degree is just a subtype of text. You can transcribe audio to text. Having said that audio also contains voice, intonation, emotions etc. which could also be mined. Video is a subtype of audio (text) and image. The video is made up of image frames. The same techniques as for images can be applied.
Queues
Queues as a data source have been around for a long time, e.g. Java Message Service, Apache ActiveMQ. More recently and with the rise of Big Data we have seen distributed queues such as Apache Kafka. Queues are a niche data source but frequently found in Streaming and enterprise integration scenarios.
IOT
IOT data is typically very large and repetitive, e.g. a measurement of temperature does not typically change suddenly. Just like any other data IOT comes with metadata, e.g. the location where it was recorded, the time the measurement took place etc. Most of this data is of no interest due to its repetitive nature. The main type of transformation when dealing with IOT data is data reduction. Various techniques such as data removal, clustering, sampling etc. can be applied between Landing and Staging. You can also apply the data reduction techniques prior to the data reaching the Landing area, e.g. directly on the device itself. The vast majority of IOT data can be safely discarded using data reduction techniques.
Frequently we are interested in outliers when analysing machine generated data.
Geospatial data
Geospatial data is another type of data that is gaining a lot of attention. You can use geospatial data for location analytics. We have written in depth about location analytics elsewhere on this blog. Geospatial data is frequently locked away in various proprietary formats, e.g. Shapefiles, ESRI Geodatabases etc. You convert geospatial data from
Other
There are dozens if not hundreds of other proprietary formats, e.g. Access databases, EDI, mainframe, cobol copybooks, binary formats etc.
Integration layer
The integration layer is mainly concerned with storing master and reference data. These are either lookup tables that add context to event or transaction data or core business entities such as Product, Customer, Employee etc.
The integration layer serves multiple objectives.
- It minimises or removes redundancies and duplication, e.g. you might have the same customer record duplicated across multiple systems.
- It makes sure that you are storing accurate data. As part of the Integration layer you can define data quality rules that record data quality defects in an error hospital
Let’s go through an example:
Records or attributes for the Customer entity may be stored across multiple data sources. This may result in errors and ambiguities across these operational systems.
| Customer Record System 1 | |||
|---|---|---|---|
| Customer Name | Street | Post code | City |
| James Smith | 56 Temple Rd | – | London |
| Customer Record System 2 | |||
| Customer Name | Street | Post code | City |
| Jim Smith | 56 Temple Road | SW9 9AF | London |
In the above example, is James Smith the same person as Jim Smith?
In the Integration layer we try to resolve these issues. The task of resolving ambiguities across database records is called entity resolution or record linking.
Entity Resolution is the task of disambiguating manifestations of real world entities in various records or mentions by linking and grouping.
Entity resolution can get tricky with large volumes of data and requires careful planning and the right tools. Entity resolution will take the ambiguous records and use various rules and matching techniques to create a golden record. You can read more about entity resolution in this article https://www.datacommunitydc.org/blog/2013/08/entity-resolution-for-big-data
Lean integration layer
Data integration should be tackled strategically as part of an enterprise data integration and Master Data Management program. For most smaller organisations such a program is not within reach of their budgets. Hence the problem of data integration frequently lands with the data analytics team and their data engineers to resolve. Data integration is a huge undertaking. It is complex and requires significant resources.
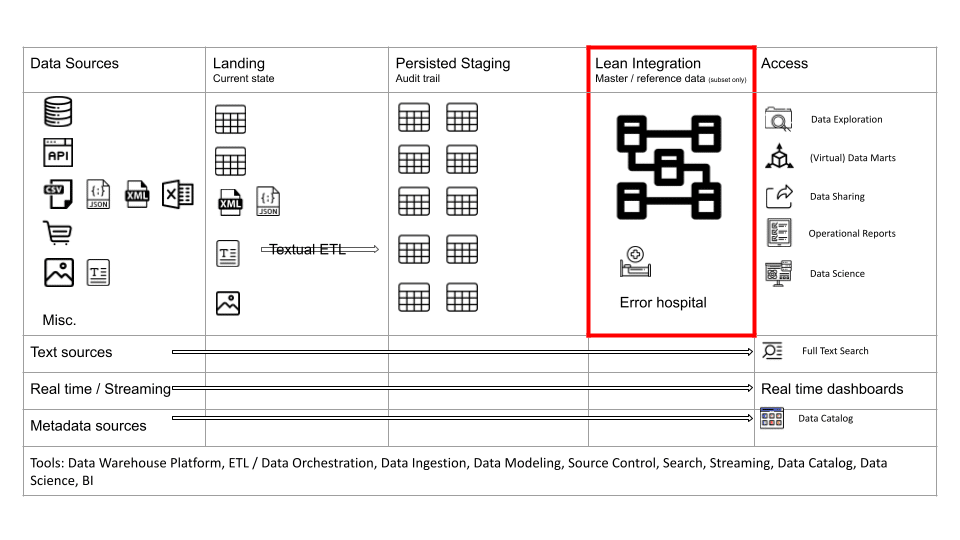
We recommend a tactical approach to data integration as part of the data analytics architecture. Errors and ambiguities are dealt with for the core entities and the priority use cases. It is inevitable that not all errors and ambiguities can be resolved as part of the data analytics program. At Sonra we favour a lean integration approach that looks at the core entities of a company that are spread across multiple data sources. For those entities we implement a tactical data integration solution.
Data marketplace
You might be surprised to see the data marketplace mentioned alongside the Integration layer.
The vast majority of reference data is either universal or at least used industry wide. Here are some examples for universal reference data:
- calendars
- currency codes
- post codes
- country codes
- Legal Entity Identifier (LEI)
- polygons and hierarchy of administrative boundaries
Different industries have their own industry specific reference data.
- Stock tickers in finance
- ISBN is a unique identifier for books in e-commerce
You can buy reference data from data marketplaces to augment or replace your own data. Sonra has made a universal geography dimension available on the Snowflake marketplace. It contains reference data for all countries in the world, e.g. country codes, population, currencies, administrative levels and much much more.
Metadata layer
The Metadata layer is a crucial component in data architecture. Unfortunately, it is frequently overlooked.
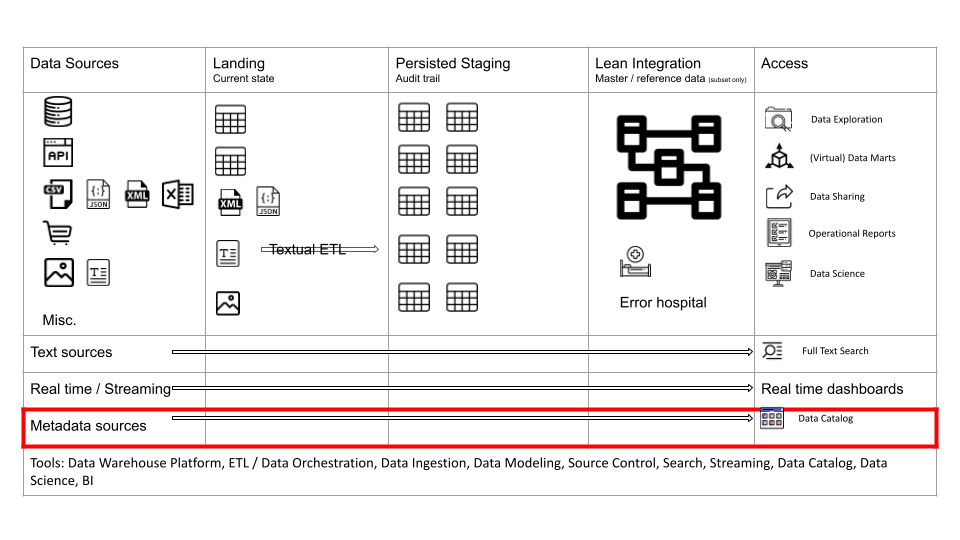
In the Metadata layer we store data about data. This data comes from different sources, e.g. your dimensional modeling tool, the information schema of your data platform or data sources, access logs, your BI tool, your ETL tool etc. etc.
I have listed some examples for the type of data that is stored in the Metadata layer.
- Data classifications, e.g. classifying data into categories such as confidential, PII etc.
- Table names. column names, data types, constraints, relationships
- Data lineage
- Data glossary or data dictionary
- Data quality issues
- Data profiles, e.g. data distributions
You can think of the metadata layer as a separate data warehouse for metadata.
There are several use cases for metadata:
- Automation. Let’s go through an example. Using data lineage you can determine the data masking requirements of downstream columns in your data pipeline based on masking policies at the most upstream columns in the pipeline. You might have defined data classifications and masking policies against attributes in your source data. Using column level data lineage you can automate the application of data masking across your pipeline end to end.
- You can use the metadata layer to feed your data catalog, e.g. to improve the findability of data sets
SQL is a core piece of metadata. It contains a lot of valuable information, e.g. data lineage, an audit record of table and column access and much more. You need an SQL Parser to process SQL and deconstruct it into its components. We have created an online SQL Parser that will allow you to just do that.
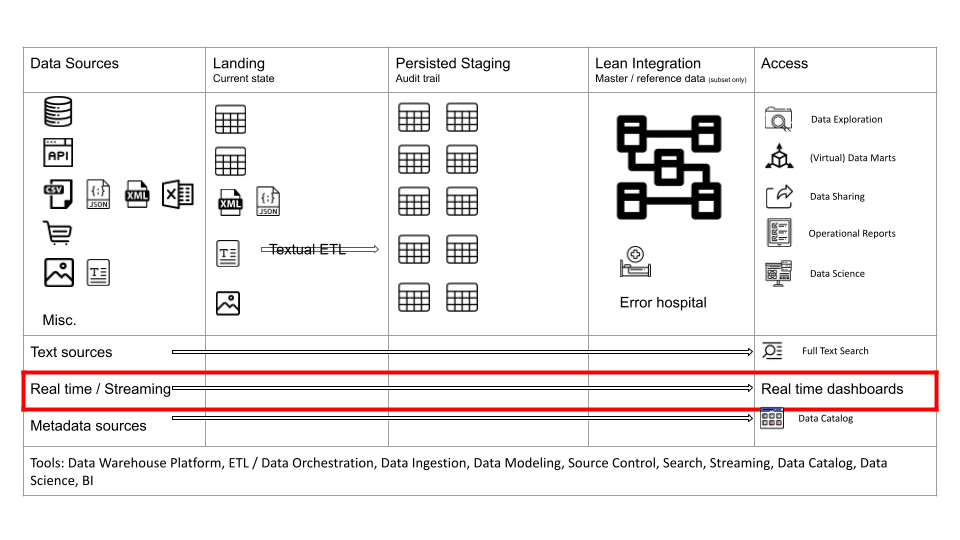
Real time layer
Most data analytics scenarios do not require a real time layer. However, there are certain industries where real time use cases are more common than in others. Industries where machines generate data come to mind. Think of Formula 1 racing as an example. E-Commerce is another industry where decisions need to be made in real time. Fraud detection is a classic example. Deciding if a credit card transaction is fraudulent requires a real time decision in seconds.
There is a lot of hype around real time analytics. Some of it justified, most of it a distraction. Do not implement a real time solution just for the sake of it. Before going down the real time route ask yourself the following questions:
- Do you make a decision in real time based on the analytic insights you generate in real time?
- Is the decision making process automated and does not require human intervention?
If the answer to these questions is No then you don’t have a real time use case and you should not implement a real time layer.
Implementing real time solutions is complex. The tools and concepts are relatively new. The technology is still maturing and the project failure rate is higher than for non real time analytics. I have written elsewhere on this blog about implementing real time analytics.
Operational reporting is another scenario for real time reporting. I will go through it in a moment.
Let’s first go through some core concepts and terminology for streaming scenarios.
Streaming versus micro batches
You can implement real time requirements in pure streaming or in micro batches. Streaming prioritises latency over throughput and micro batches prioritises throughput over latency. Streaming just looks at one event or message at a time.
Delivery semantics
Early streaming platforms did not make guarantees around the delivery of messages. Messages could get lost or delivered more than once. When looking at delivery guarantees you should be looking at exactly once delivery semantics.
State
Stateless Computation
A stateless computation generates an output based on a single event.
Examples
- A sensor that measures temperature. If the temperature goes above a certain threshold an alarm is raised
- A function that splits a name into first and last name
- A simple key/value lookup
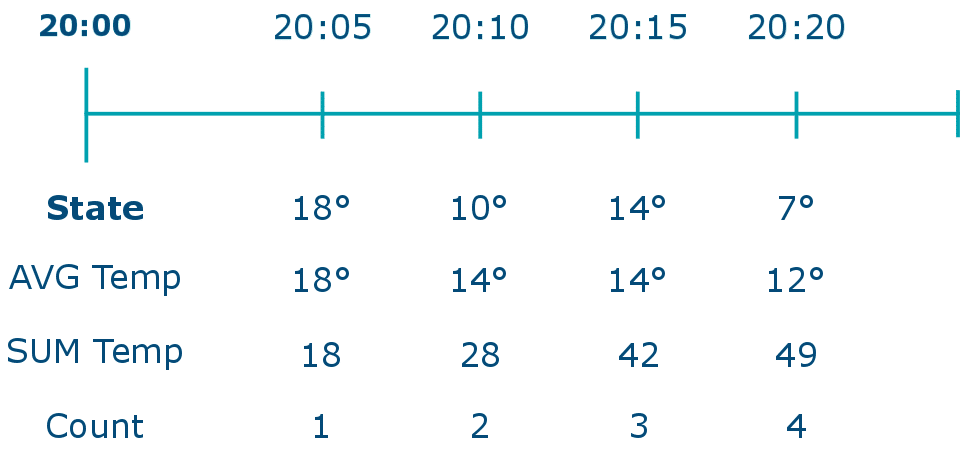
Stateful Computation
A stateful computation produces output based on multiple events as part of a window, e.g. a count of events over a period of time.
Examples
Average temperature over a window of 1 hour, 1 day, 1 month etc.
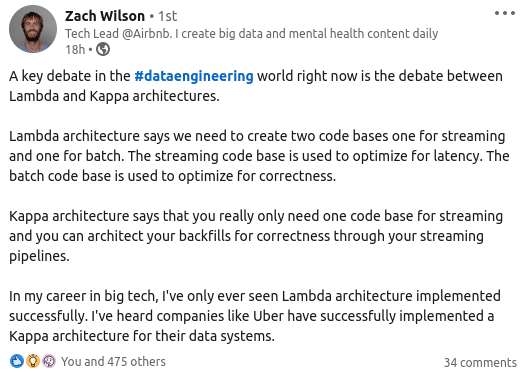
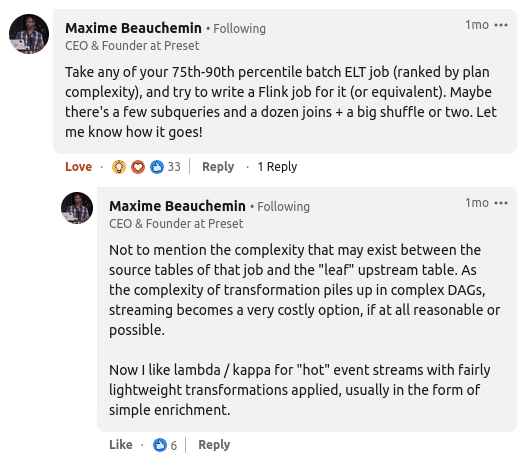
Lambda versus Kappa
There is an on-going discussion in the streaming community between the Lambda architecture and the Kappa architecture. The Kappa approach advocates to run all ETL as real time streaming jobs. The Lambda approach advocates separating between batch / micro batch processing and streaming. The “original” rationale for the Lambda approach was to accommodate technical limitations in early streaming platforms such as Storm. These platforms did not support exactly once semantics. In other words these platforms did not guarantee that all events were processed or only processed once. Over the last few years this issue has been addressed in more mature streaming platforms such as Flink or Spark Structured Streaming.
However, there are other factors at play that make Kappa unsuitable for a wide range of scenarios and use cases.
In theory it makes intuitively sense to have just one code base for batch and streaming and to get rid of batch altogether. This is until you take a closer look at the practical implications of this approach.
First of all, the technology and concepts such as windowing, delivery semantics, concepts of time and state etc. are new. Streaming platforms are relatively immature and the concepts are evolving. Compare this to batch and micro batch processing, which has been successfully used for decades.
If you run into issues in a pure streaming environment you have by definition less time to fix the issue. You can compare this to an airplane, which is most vulnerable during take off and landing as the possible reaction time to address issues is quite short. This makes streaming pipelines brittle and complex to implement in comparison to batch processing. Generally in data engineering we strive to keep things simple and only introduce complexity when absolutely necessary. In other words we only want to introduce streaming where it adds business value and we have a genuine use case.
Apart from simple scenarios, e.g. stateless event processing or processing of additive aggregates (think of count, average, sum) streaming does not work. How do you calculate a non-additive measure in a streaming fashion, e.g. a DISTINCT COUNT. Indeed, this is not possible. You need to look at the full window, in other words you need to batch or micro-batch.
Vendors of streaming platforms have a vested interest for organisations to implement streaming. Hence companies such as the makers of Kafka (Confluent) are the noisiest when it comes to pushing the Kappa architecture.
Based on a recent streaming discussion on LinkedIn that I was involved in it seems that not many companies have actually implemented a Kappa architecture. I have taken some screenshots of the more interesting contributions in the thread. But please have a look for yourself.
In summary, the Kappa architecture seems to offer significant benefits over a Lambda approach. However, when we look under the surface it is more ambiguous. Kappa works for simple stateless scenarios but comes at the price of complexity and requires skillful (translate expensive) resources. For most scenarios the Lambda approach is superior. Only implement real time requirements when you have one and where possible at all. Everything else should be implemented as batch processing. How do you know that you have a realtime requirement? Simply answer the following question: What action do you and the business units take in real time based on the insights that are generated in real time.
Access layer
In the Access layer we make data available to end users and consumers. The Access layer covers multiple use cases and applications
(Virtual) data marts
The data marts are mainly used for Performance reporting. These are the dashboards and KPIs that you use to measure the overall performance of an organisation.
The data marts can also be used for other use cases, e.g. as a source for feature engineering of predictive models or data sharing use cases.
One common approach is to build virtual data marts where you use database Views to create virtual fact and dimension tables and the virtual business transformation logic to meet requirements. This accelerates the implementation as it requires less ETL code. Sometimes this comes at the expense of decreased performance. When you run into performance issues you can convert those virtual dimension and fact tables that perform poorly into physical tables. Using a data warehouse automation approach, this can be done at the click of a button.
Operational Reports
Operational Reports have different characteristics to reports that measure the performance of the organisation based on industry or company metrics. The latter typically aggregate data and require large table scans to display KPIs to management, e.g. the number of claims made in the last quarter.
Operational Reports on the other hand typically select a subset of the data based on filters, e.g. all the claims of a particular customer or a list of claims that need to be investigated
I have summarised the differences between the two
| Operational Reports | KPIs / Dashboards |
|---|---|
| Detailed look at individual items | High-level look at an organization’s performance |
| For operational (day to day) decisions | For strategic, long-term decisions |
| Individual data points or lists | KPIs and metrics. Data is aggregated |
| Decisions may happen in near real time. May require data in near real time. | Decisions are never made near realtime. Never requires data in real time or near real time |
| Typical business question: List of our sales reps in Dublin and their sales figures | Typical business question: What are our sales figures for 2020 by region |
Operational Reports typically have a real time or near real time requirement, e.g. an attendance list for an event or ringing up a list of clients in arrears requires up to date information.
Often a good place to implement operational reporting is in the operational source system itself. If you need to run operational reports across multiple sources you can use data federation. This is one of the few scenarios where data federation actually works.
We can also implement Operational Reporting as part of the data analytics architecture. It requires us to ingest our data in near real time, e.g. by using a tool that can replicate data in near real time to Landing and Staging from relational databases (more on this in a moment when we talk about technology). We can run the reports against the Landing or Staging area, which can double up to what is known as an Operational Data Store in traditional data architecture.
Data exploration
Business and data analysts get access to data in the Staging, Integration and Data Marts layer for ad hoc analysis, data discovery, and data exploration.
Data science
Data scientists get access to data in the Staging, Integration and Data Marts layers for feature engineering and to build predictive models. It is typically preferable for data scientists to access data in the Integration and Data Marts layers as integration and business transformation logic has already been applied. However, frequently not all of an organisation’s data has made it into the data marts layer. For those scenarios and where they need to access raw data, data scientists can access the data in the Staging layer.
Once data has been scored against the predictive model the output, e.g. the probability of a customer churning can be stored in the Access layer for reporting and decision making.
Data sharing
Most organisations share some of their data with third parties such as suppliers, partners, or customers.
In many cases the data marts can be shared out directly by implementing some form of row level security. Both internal and external staff access the same data structures but with a dedicated security model based on the organisation they belong to.
Free text search
One use case for textual data is free text search. You can index the words in text documents similar to a book. It is called an inverted index. Using a search engine you can run keyword searches against your text documents.
You can also combine the keywords from text with structured data for what is called Faceted Search. Everyone who has been on the Amazon website has been using Faceted Search.
Keyword search
On Amazon you type in a keyword first

Combined with faceted search
You can then filter the results of the keyword search by so-called facets. Facets work as filters to further drill into the search results.
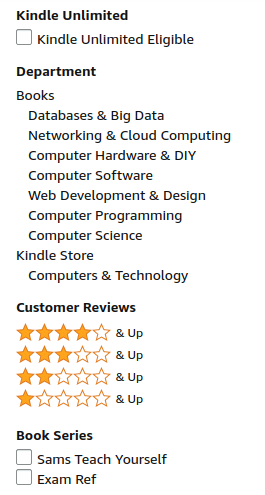
Facets are typically generated from metadata or derived from free text by using text mining techniques, e.g. feature extraction or taxonomy lookups.
Data catalog
Companies use data catalogs to make it easier for data analysts and data scientists to find and discover useful corporate data sets. A data catalog typically contains a data dictionary with the descriptions, keywords and tags for tables and columns in a data warehouse, data management system, or database.
The data catalog is typically loaded from the metadata layer. An SQL Parser can be useful for populating a data catalog with metadata.
Others
There are many other (niche) use cases and consumers for the access layer.
You can add various data marts about metadata, e.g. an error hospital to monitor and measure data quality violations over time. Another example would be a data mart for security analytics, e.g. to visualise role based access and permissions and access violations.
You might have real time dashboards and alerts, e.g. the number of web visitors currently on your website
You can embed analytics and data marts in applications, e.g. mobile applications or games.
Graph computations are another use case. I have written about the relevance of graphs for data warehousing elsewhere on this blog. One key takeaway about graphs is that understanding the concept and graph algorithms is highly relevant. Graph computation engines are also very useful. Graph databases on the other hand only have niche relevance for certain edge cases.
Principles and context
So in a nutshell I have walked you through the Sonra reference data architecture for analytics. We have covered a lot of ground but are only half way there. When we map the logical architecture to tools and vendors we need to take the context of the organisation into account.
The types of tools you select are highly dependent on your requirements, your company culture, the skills you have in-house, preferences (e.g. build vs. buy), budget, existing vendor relations, software license model, skills and much more. One size certainly does not fit all.
Having said that, at Sonra we believe in some fundamental principles that guide our recommendations for tools and vendors. These are our first principles.
- Data has gravity. Moving large amounts of data frequently across distant networks is not a good idea. For most data analytics projects we want to co-locate data. It should be at least in the same data centre. Better on the same rack or cluster. Data has gravity and we don’t want our data to travel repeatedly over networks. This requires a central data platform, e.g. looking at the cloud you want all of your data in the same region and availability zone. Data federation, data virtualisation, data fabric etc. works for some edge cases. It is generally not suited for federating larger volumes of granular data across regions. I have put together some thoughts around data virtualisation in a separate blog post.
- Closely related to this principle is the idea of bringing your processing to the data rather than moving the data to the processing. This rules out traditional ETL tools that pull data into their own storage layer to apply business transformation or integration logic. The movement of data should be limited where possible. Any data movement introduces additional points of failure and makes the overall solution more complex. As always, keep things simple.
- Automation is king. We aim to automate as many of our processes as possible. Often you need to implement a manual process. Over time you can detect the patterns and automate things. This principle means that we favour tools that allow us to automate things. We look at tools that have a rich set of SDKs and APIs. As an example we choose data warehouse automation tools over GUI ETL tools. I have written extensively about data warehouse automation elsewhere on this blog.
- SQL is the language of choice for data analytics and data engineering. You need to complement this with scripting languages such as Python for certain scenarios. You also need some hard core software engineering skills on your teams but this is the topic for another article.
- Tools that scale up and out are preferred over tools that only scale up or don’t scale at all.
- Cloud is preferred over on-premise
- Serverless and fully managed is preferred over self hosted.
- Minimise the number of third party vendors where possible but not at the expense of tool quality. What this means is that if you require two tools where one vendor can offer both and has the same or similar quality (meets your requirements) to two alternative vendors then pick the vendor that offers both tools.
So there you have it. The seven commandments of data architecture that will guide us when translating the logical to a physical architecture.
Physical Data Architecture
We have talked a lot about the logical architecture and covered a lot of ground. Let’s finally look at tools, technology and all the toys that are out there.
Let’s first go through the list of tools that you will need on a typical data project.
- Ingestion tool for relational databases. We recommend using tools that read the transaction logs of a database for near real time ingestion. Beware though that this can be tricky to set up in a robust manner and you will need comprehensive technical knowledge to make it work. Please refer to my post about real time streaming.
- Ingestion tool for APIs. With the rise of SaaS applications and APIs a new breed of tool has emerged that offers abstractions on top of APIs. This is a nice to have rather than must have. It is pretty straightforward to write your own code to query APIs.
- ETL or better a data warehouse automation tool.
- Data modeling tool. For smaller projects or PoCs you may get away without a data modeling tool. However, for enterprise implementations you will need one. Data modeling tools are not only useful for data modeling but also for other metadata such as data classifications or data dictionaries and much more. Information from the data modeling tool can feed into your data catalog.
- Source control
- Data orchestration and scheduling
This is just a bare minimum list for an enterprise project. You will need other tools as well. However, any other tools are optional and depend on your use cases and requirements, e.g. you might have data science use cases, or unstructured data, or a streaming requirement etc.
Okay? Let’s briefly take stock. We have found out that data architecture is located at the conceptual level. It is timeless and universal and abstracted from tools and technologies. In the next step we defined a reference enterprise data architecture for data analytics and data management projects. In a third step we defined the principles that guide us when selecting a tool or vendor. The moment of truth has come where we take all of our insights and translate them to a physical architecture with actual tools and technologies. It took us a while to get here and this is only the final step in a long process rather than the first thing to look at.
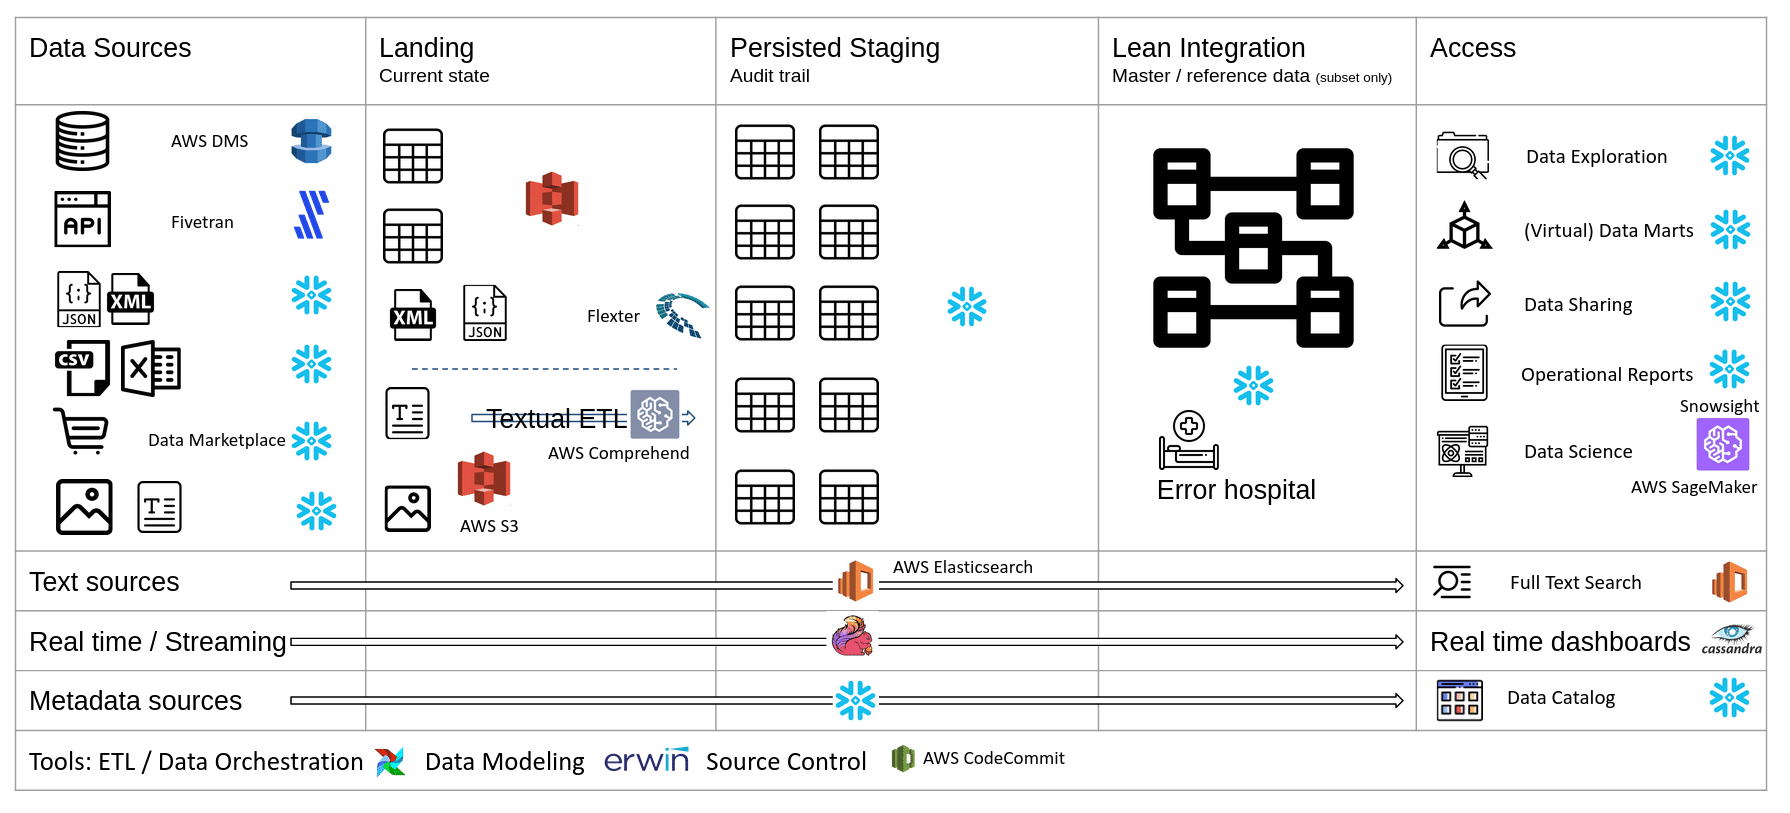
Reference data architecture on Snowflake (AWS) V1
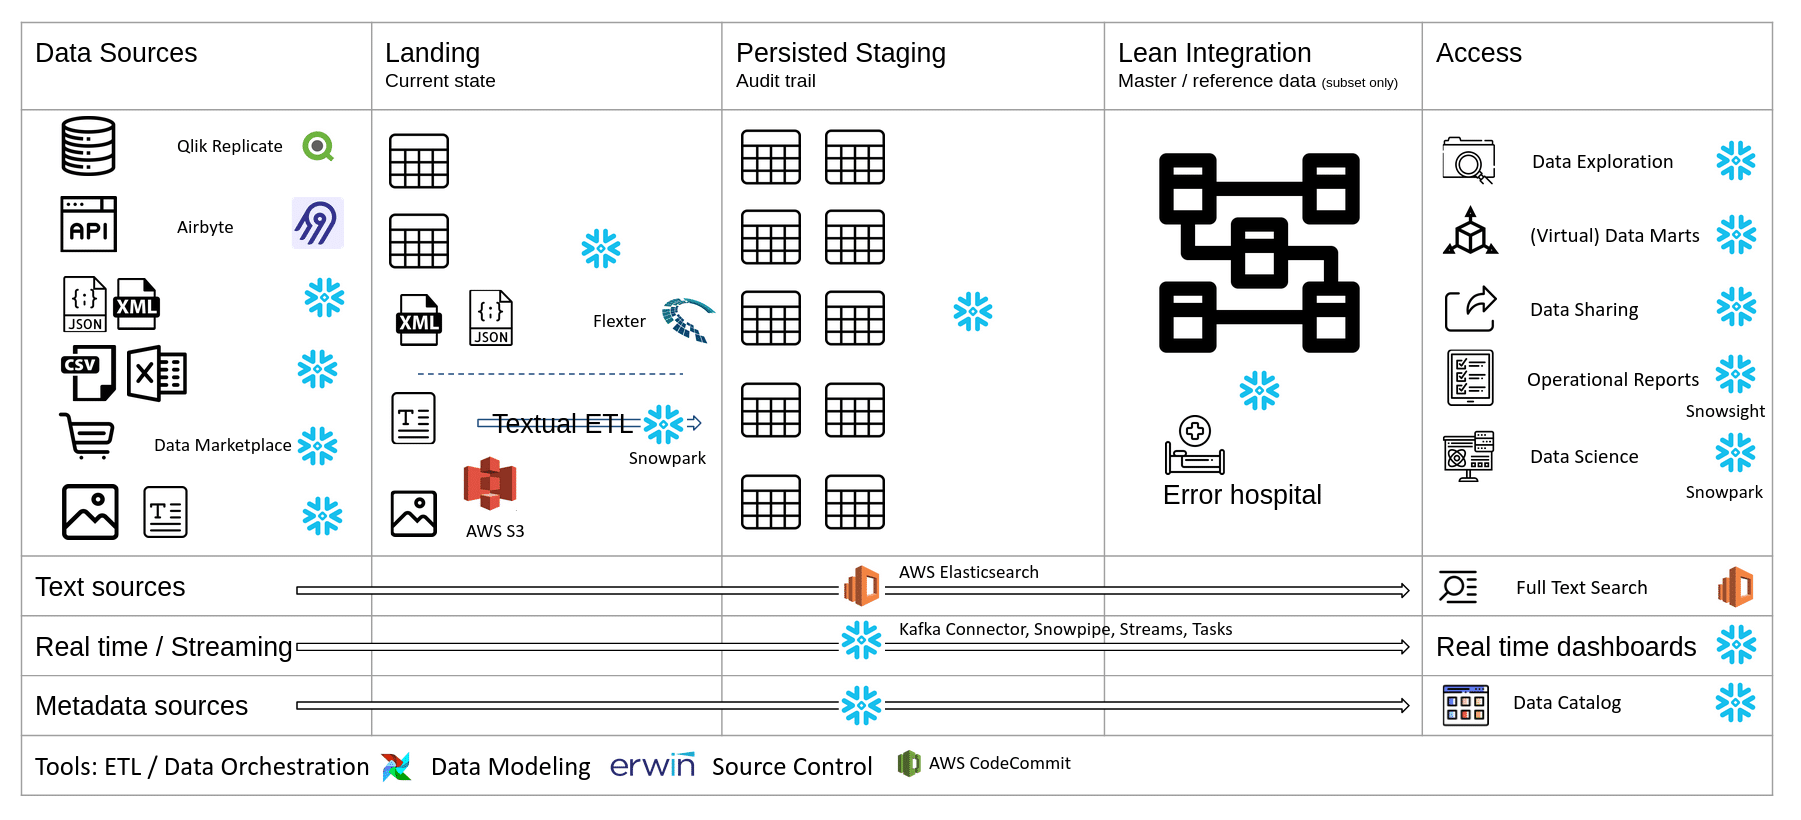
As you can see there are a lot of Snowflake datalake architecture icons in this diagram. Sonra partners with Snowflake and you might think this is expected. The thing is though that we partner with them for a reason. And that reason is that the platform is just superb with a clear and brilliant vision. Snowflake ticks all of the Sonra principles for selecting tools I laid out earlier.
Let’s go through the various components in more detail. I will give you the rationale for selecting each of them.
Ingestion
For ingesting data in near real time we use Qlik Replicate to read transaction logs of a database. Qlik is a very robust solution. It is also available as a managed service and white labeled as AWS DMS. In this incarnation it does not support Snowflake as a target database.
We have recently spent some time evaluating Airbyte, which is an open source tool for ingesting data from common SaaS APIs. There are a lot of things to like about Airbyte, e.g. an SDK for developing connectors that can in turn be monetised and the pricing model once they roll things out at an enterprise level.
You can use Snowflake native features to load text, XML and JSON files.
For Excel files you can use Snowflake Excelerator.
Landing and Staging
Apart from unstructured data we store data inside Snowflake tables. For unstructured data we land the data on AWS S3.
We land and stage free text documents on AWS Elasticsearch and create an inverted index for free text searches.
For streaming data you can use Snowpipe or the Snowflake Kafka connector to land the data in Snowflake tables. For downstream processing you can use Snowflake streams and tasks.
You can store and land your metadata sources directly inside Snowflake. One rich source of metadata is the Snowflake information schema.
Integration
You can build the integration layer directly inside Snowflake using SQL. The same applies for the error hospital and data quality rules.
Access
For data exploration real time reports, and operational reports and dashboards we recommend Snowsight. As operational reports tend to be quite simple, Snowsight is a perfect fit as it is a neat solution and not overloaded with hundreds of features that you don’t need for operational reports. This will also help you with saving on license costs for seats in your BI tool.
For data science use cases you can use Snowpark. Snowpark is a recent addition to Snowflake. As of the time of this writing, you can’t build and train a model directly inside Snowpark. However, you can score the model.
For full text search you can use AWS Elasticsearch.
We don’t recommend purchasing a data catalog tool. These tend to be quite pricey and it is hard to adapt them to your own specific requirements. We recommend building your own data catalog to suit your own very specific requirements. We have created an SQL parser that will allow you to meet various data catalog and data governance requirements.
ETL
For ETL, data warehouse automation we use Apache Airflow. We created our own reusable code templates to automate common data integration patterns. You can read up on the approach we follow in a separate blog post on a separate blog post of mine on data warehouse automation. We also use Airflow for data orchestration and scheduling.
For converting complex XML and JSON to a readable and relational format we use Flexter. Flexter can convert any XML to Snowflake in seconds. You can book a demo. For simple JSON, we recommend Snowflake native functionality to convert the JSON documents.
For textual ETL you can use Snowpark or AWS Comprehend as an alternative.
Reference data architecture on Snowflake (AWS) V2
Here is an alternative physical implementation of the reference architecture.
What’s next?
You might have noticed that I did not mention the term data warehouse in connection with the reference data architecture. While a debate around terminology and naming is important it is not hugely relevant for successfully implementing an enterprise data architecture. I will write a separate post where I cover terminology such as data warehouse, data lake, data lakehouse, data management platform and various others in more detail.
I hope you enjoyed this article. If you have any questions you can reach out to me and connect on LinkedIn.
I would be curious of how you translate the logical reference architecture to tools and vendors and the principles that guide you. Connect on LinkedIn and share your thoughts and physical data architecture diagram.
Sonra offers data architecture and data advisory services to fit the reference data architecture to your own needs and requirements.
We can also help you to translate the logical architecture to a physical architecture through our vendor selection service.
If you are looking for a strong partner for your Snowflake implementation you can rely on Sonra. We have been working with Snowflake for the last five years. Sonra is one of the first Snowflake partners in EMEA and we are on the Partner Advisory Council.
Uli Bethke
Uli has been rocking the data world since 2001. As the Co-founder of Sonra, the data liberation company, he’s on a mission to set data free. Uli doesn’t just talk the talk—he writes the books, leads the communities, and takes the stage as a conference speaker.
Any questions or comments for Uli? Connect with him on LinkedIn.
Follow Uli Bethke: