Parsing SQL queries in Redshift for table and column audit logging

This is the fourth article in our series on parsing SQL in different database technologies and SQL dialects. We explored SQL parsing on Snowflake, MS SQL Server, and Oracle in our earlier blog posts. We cover SQL parsing on Redshift in this blog post.
We provide practical examples of deconstructing SQL from the Redshift query history. Additionally, we will present some code that utilises the FlowHigh SQL parser SDK to programmatically parse SQL from Redshift. The parsing of Redshift can be automated using the SDK.
In another post on the Sonra blog, I go into great depth on the use cases of using an SQL parser for data engineering and data governance. This article is a complete deep dive into SQL parsing, how it works and how you can use it for use cases in data engineering and data governance.
One example for a use case would be table and column audit logging. Audit logging refers to the detailed recording of access and operations performed on specific tables and columns in a database including execution of SQL queries. Such logging can be essential for ensuring security, compliance with regulatory standards, and understanding data access patterns.
SQL parser for Redshift
Sonra has created an online SQL parser. Our vision is to be SQL dialect agnostic. The parser also works with Redshift. It is called FlowHigh. This SaaS platform includes a UI for manual SQL parsing as well as an SDK for managing bulk SQL parsing requirements or automating the process. We demonstrate FlowHigh’s capabilities by parsing the query history of Redshift.
Let’s look at both options starting with the SDK for automating SQL parsing.
Programmatically parsing the Redshift query history with the FlowHigh SDK
Redshift Serverless has a table called “sys_query_history”. It contains data about the SQL query that was run. The executed query can be obtained from this table and sent to FlowHigh for analysis.
The Redshift query history
is also store in other system tables such as STL_QUERY.
To get the text of the query and the users who ran it, we can use the query below.
|
1 2 3 4 5 |
SELECT user_id, query_id, query_text FROM sys_query_history ORDER BY start_time desc; |
The python code in the next section shows how the query history is pulled from Redshift and processed using the FlowHigh SDK:
|
1 2 3 4 5 6 7 8 9 10 11 12 13 14 15 16 17 18 19 20 21 22 23 24 25 26 27 28 29 30 31 |
import pandas as pd from sqlalchemy import create_engine,text from flowhigh.utils.converter import FlowHighSubmissionClass # Connect to the cluster host = '<host_endpoint>' database = '<dbname>' port = 5439 user = '<user_name>' password = '<password>' # Create an SQLAlchemy engine engine = create_engine(f'redshift+psycopg2://{user}:{password}@{host}:{port}/{database}') query = ''' SELECT query_id, query_text FROM sys_query_history ORDER BY start_time desc; ''' with engine.connect() as connection: result = connection.execute(text(query)) print(result) data = [] for query_id, query_text in result: fh = FlowHighSubmissionClass.from_sql(query_text) json_msg = fh.json_message entry = {'query_id': id, 'fh_response': json_msg} data.append(entry) data_df = pd.DataFrame(data) # loading the result to Redshift database data_df.to_sql('your_table_name', engine, index=False, if_exists='append') |
We used Redshift Serverless to parse the queries
Analysing the output of the FlowHigh SQL parser
The FlowHigh SQL parser for Redshift processes incoming SQL queries and outputs the results in either Redshift JSON or XML format. For example, from our collected query history, the parser generates a comprehensive JSON or XML representation of the SQL query. This detailed output includes data on filter criteria, retrieved columns, aliases used, join conditions, tables, and other clauses of the SQL command.
Let’s go through an example
|
1 2 3 4 5 6 7 8 9 10 11 12 |
SELECT sales.salesid ,sales.pricepaid ,event.eventname ,category.catname FROM sales JOIN event ON sales.eventid=event.eventid JOIN category ON event.catid=category.catid WHERE sales.pricepaid>500 GROUP BY sales.salesid ORDER BY sales.saletime DESC; |
The SQL parser
also supports other DML and DDL statements such as CREATE, INSERT, UPDATE, MERGE etc.
Let’s look at the XML version of the FlowHigh SQL parser for the above SQL statement. The output of XML is slightly more condensed than the JSON message.
|
1 2 3 4 5 6 7 8 9 10 11 12 13 14 15 16 17 18 19 20 21 22 23 24 25 26 27 28 29 30 31 32 33 34 35 36 37 38 39 40 41 42 43 44 45 46 47 48 49 50 51 52 53 54 55 56 57 58 59 60 61 |
<?xml version="1.0" encoding="UTF-8"?> <parSeQL version="1.0" status="OK" ts="2023-09-16T11:46:30.754Z" xmlns:xsi="http://www.w3.org/2001/XMLSchema-instance" xsi:schemaLocation="https://flowhigh.sonra.io/flowhigh_v1.0.xsd"> <statements> <statement pos="0-290"> <ds pos="0-290" type="root" subType="inline"> <out> <attr pos="7-13" oref="C1"/> <attr pos="29-15" oref="C2"/> <attr pos="53-15" oref="C3"/> <attr pos="77-16" oref="C4"/> </out> <in> <ds pos="102-5" oref="T1"/> <join type="inner" definedAs="explicit"> <ds pos="116-5" oref="T2"/> <op pos="130-27" type="EQ"> <attr pos="130-13" oref="C5"/> <attr pos="144-13" oref="C6"/> </op> </join> <join type="inner" definedAs="explicit"> <ds pos="165-8" oref="T3"/> <op pos="182-26" type="EQ"> <attr pos="182-11" oref="C7"/> <attr pos="194-14" oref="C8"/> </op> </join> </in> <filter xsi:type="filtreg"> <op pos="216-19" type="GT"> <attr pos="216-15" oref="C2"/> <const>500</const> </op> </filter> <agg xsi:type="aggreg"> <attr pos="246-13" oref="C1"/> </agg> <sort> <attr pos="271-14" direction="desc" oref="C9"/> </sort> </ds> </statement> </statements> <DBOHier> <dbo oid="T1" type="TABLE" name="sales"> <dbo oid="C1" type="COLUMN" name="salesid"/> <dbo oid="C2" type="COLUMN" name="pricepaid"/> <dbo oid="C5" type="COLUMN" name="eventid"/> <dbo oid="C9" type="COLUMN" name="saletime"/> </dbo> <dbo oid="T2" type="TABLE" name="event"> <dbo oid="C3" type="COLUMN" name="eventname"/> <dbo oid="C6" type="COLUMN" name="eventid"/> <dbo oid="C7" type="COLUMN" name="catid"/> </dbo> <dbo oid="T3" type="TABLE" name="category"> <dbo oid="C4" type="COLUMN" name="catname"/> <dbo oid="C8" type="COLUMN" name="catid"/> </dbo> </DBOHier> </parSeQL> |
The XML output generated by the FlowHigh SQL parser for Redshift provides an in-depth analysis of the SQL statement.
Tables and columns
This includes a full list of table names, associated join conditions, and other essential attributes that can be derived from the XML structure. From our example, FlowHigh points out attributes such as salesid, pricepaid, eventname, and catname which are obtained from tables named sales, event, and category.
Joins
Additionally, two inner joins are identified in this query. The first join condition dictates that the eventid from the sales table matches the eventid from the event table. The second join condition confirms that the catid from the event table aligns with the catid from the category table.
GROUP BY
The query aggregates data based on the salesid column from the sales table.
You can find the GROUP BY in the aggregation section of the XML output
|
1 2 3 |
<agg xsi:type="aggreg"> <attr pos="246-13" oref="C1"/> </agg> |
Internally the column salesid is referenced as C1, which can be looked up from the query hierarchy <DBOHier> at the end of the XML message.
|
1 2 3 4 5 6 7 8 9 10 11 12 13 14 15 16 17 |
<DBOHier> <dbo oid="T1" type="TABLE" name="sales"> <dbo oid="C1" type="COLUMN" name="salesid"/> <dbo oid="C2" type="COLUMN" name="pricepaid"/> <dbo oid="C5" type="COLUMN" name="eventid"/> <dbo oid="C9" type="COLUMN" name="saletime"/> </dbo> <dbo oid="T2" type="TABLE" name="event"> <dbo oid="C3" type="COLUMN" name="eventname"/> <dbo oid="C6" type="COLUMN" name="eventid"/> <dbo oid="C7" type="COLUMN" name="catid"/> </dbo> <dbo oid="T3" type="TABLE" name="category"> <dbo oid="C4" type="COLUMN" name="catname"/> <dbo oid="C8" type="COLUMN" name="catid"/> </dbo> </DBOHier> |
FILTER
The query incorporates a filter condition on the pricepaid column from the sales table. Specifically, it selects records where the pricepaid value is greater than 500.You can find the FILTER in the filter section of the XML output.
|
1 2 3 4 5 6 7 |
<filter xsi:type="filtreg"> <op pos="200-19" type="GT"> <attr pos="200-15" oref="C2"/> <const>500</const> </op> </filter> <agg xsi:type |
Internally the column pricepaid is referenced as C2, which can be looked up form the query hierarchy <DBOHier> at the end of the XML message.
|
1 2 3 4 5 6 7 8 9 10 11 12 13 14 15 16 17 |
<DBOHier> <dbo oid="T1" type="TABLE" name="sales"> <dbo oid="C1" type="COLUMN" name="salesid"/> <dbo oid="C2" type="COLUMN" name="pricepaid"/> <dbo oid="C5" type="COLUMN" name="eventid"/> <dbo oid="C9" type="COLUMN" name="saletime"/> </dbo> <dbo oid="T2" type="TABLE" name="event"> <dbo oid="C3" type="COLUMN" name="eventname"/> <dbo oid="C6" type="COLUMN" name="eventid"/> <dbo oid="C7" type="COLUMN" name="catid"/> </dbo> <dbo oid="T3" type="TABLE" name="category"> <dbo oid="C4" type="COLUMN" name="catname"/> <dbo oid="C8" type="COLUMN" name="catid"/> </dbo> </DBOHier> |
ORDER BY
The results of the query are sorted in descending order based on the saletime column from the sales table. This ordering ensures that the most recent sales transactions, according to their time, appear at the top of the output, allowing users to quickly identify the latest transactions.
You can find the col used in order by in the sort section of the XML output.
|
1 2 3 |
<sort> <attr pos="252-14" direction="desc" oref="C9"/> </sort> |
Internally the column saletime is referenced as C9, which can be looked up from the query hierarchy <DBOHier> at the end of the XML message.
|
1 2 3 4 5 6 7 8 9 10 11 12 13 14 15 16 17 |
<DBOHier> <dbo oid="T1" type="TABLE" name="sales"> <dbo oid="C1" type="COLUMN" name="salesid"/> <dbo oid="C2" type="COLUMN" name="pricepaid"/> <dbo oid="C5" type="COLUMN" name="eventid"/> <dbo oid="C9" type="COLUMN" name="saletime"/> </dbo> <dbo oid="T2" type="TABLE" name="event"> <dbo oid="C3" type="COLUMN" name="eventname"/> <dbo oid="C6" type="COLUMN" name="eventid"/> <dbo oid="C7" type="COLUMN" name="catid"/> </dbo> <dbo oid="T3" type="TABLE" name="category"> <dbo oid="C4" type="COLUMN" name="catname"/> <dbo oid="C8" type="COLUMN" name="catid"/> </dbo> </DBOHier> |
While Redshift may not always provide granular details about specific tables and columns in a query, FlowHigh supplements this information. It not only identifies the tables and columns but also zeroes in on the columns involved in join operations.
FlowHigh User Interface for SQL parsing
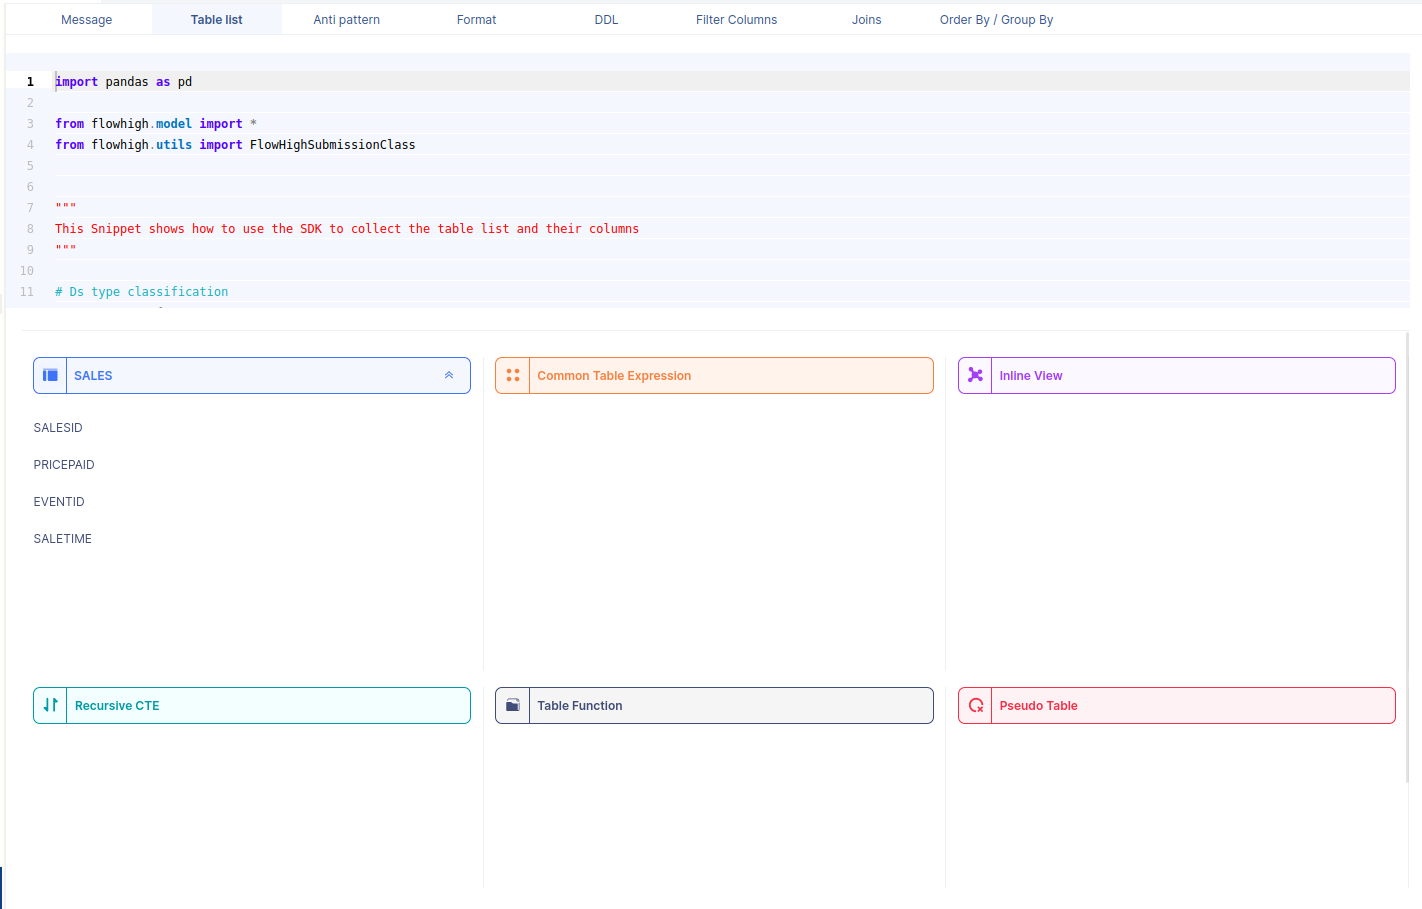
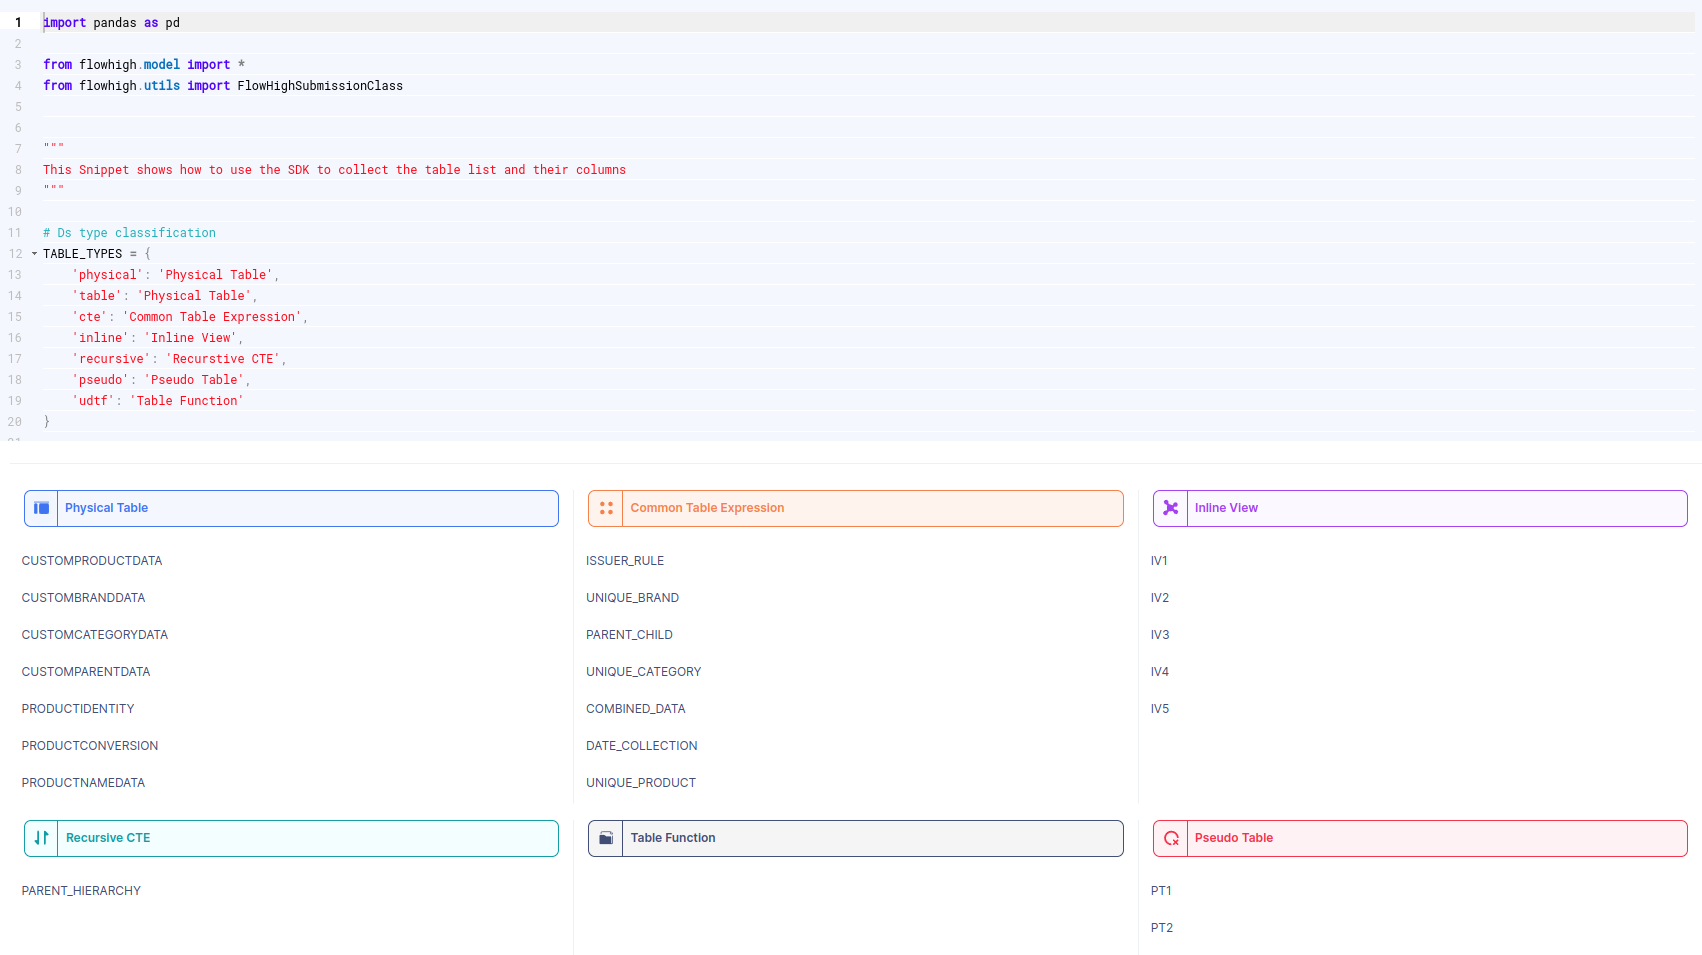
You can also access the FlowHigh SQL parser through the web based user interface. The below figure shows how FlowHigh provides the information about tables in a SQL query by grouping them into types of tables.
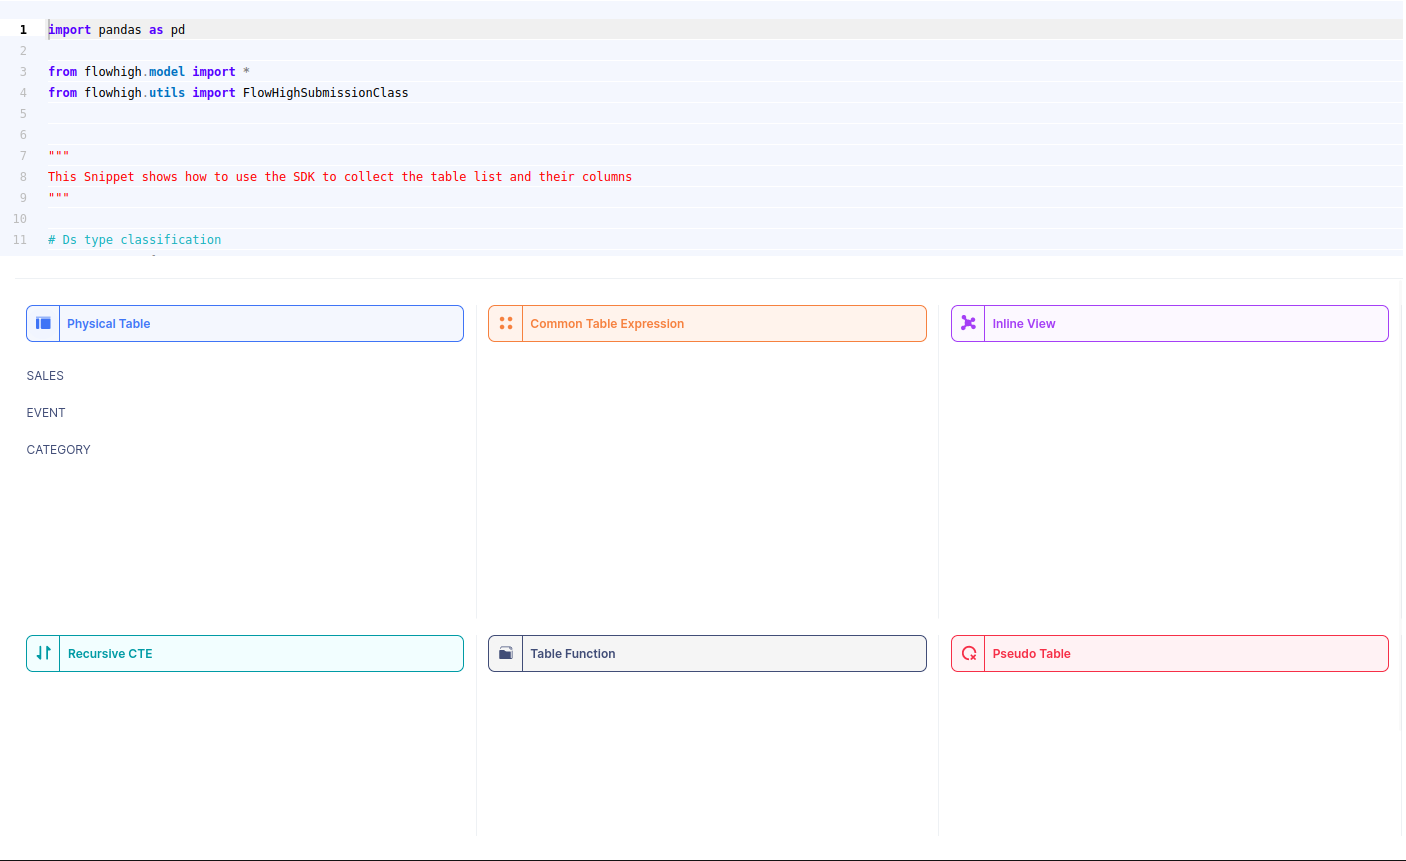
When we select a table name, it reveals the associated column names. For instance, by selecting the ‘SALES’ table, we can view its corresponding column names.
Likewise FlowHigh can be used to get columns used in a where conditions ,order by, group by and joins in the SQL query.
Columns used in GROUP BY / ORDER BY clause

This figure shows how FlowHigh can be used to filter out the columns used in order by and group by clause.
Filter Columns

Columns in join conditions
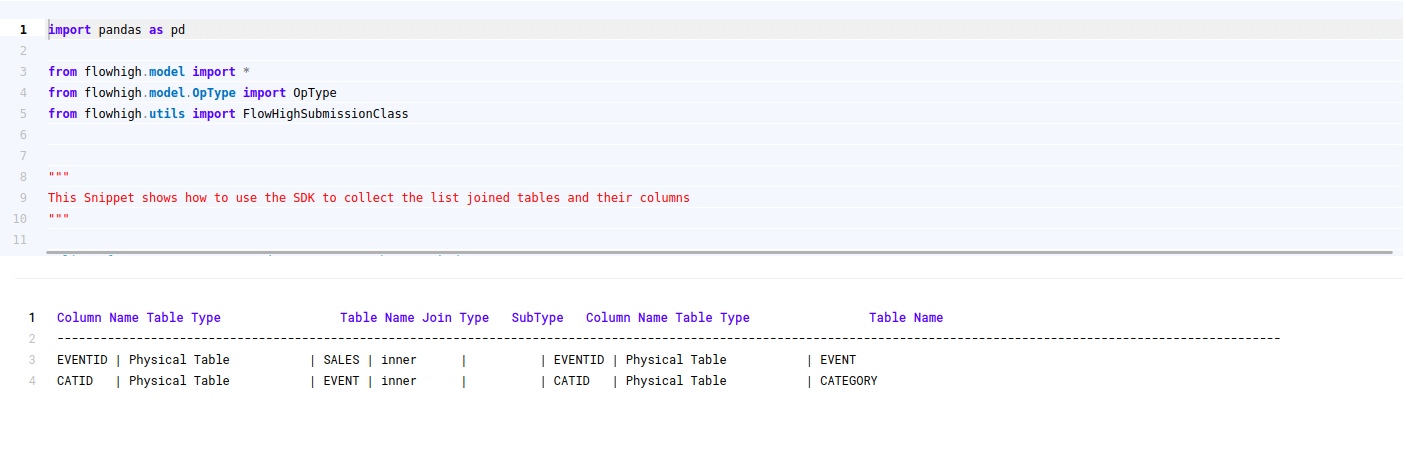
Table audit logging in Redshift
Audit logging in a database refers to the practice of keeping a detailed record (audit trail) of operations, transactions, or changes made to objects in the database such as tables, views, and stored procedures etc.
What is table audit logging?
Audit logging at the table level in a database focuses on capturing activities or changes related to individual tables. It concentrates on tables rather than a broad range of database objects like views, stored procedures, triggers, etc.
Table-level audit logging can record various activities, including:
- Data Modification: Tracks operations like INSERT, UPDATE, and DELETE, capturing when these operations occurred, by whom, and sometimes even the specific data that was changed.
- Data Access: Records when specific tables are accessed using SELECT queries.
- Schema Changes: Captures alterations to the table structure itself, such as when columns are added, modified, or deleted.
- Permission Changes: Records changes to the permissions or roles associated with specific tables.
Why do you need table audit logging?
There are various use cases for auditing access and changes to tables:
- Security: To detect unauthorised access or changes to critical data tables.
- Compliance: Regulatory requirements may require logging for specific tables containing sensitive or personally identifiable information.
- Forensics: In the event of anomalies or issues, audit logs can help trace back the series of events leading to the problem.
- Accountability: Ensures that individuals or systems are held accountable for their actions and changes made to the data.
- Identify usage patterns I: Table audit logging can identify tables that are queried frequently or queried together.
- Identify usage patterns II: You can identify tables that are not queried at all or only queried infrequently. These are candidates for archiving or dropping.
Table audit logging in Redshift
Limitations
Unlike other databases such as Snowflake, Databricks, SQL Server, Oracle etc. Redshift does not provide metadata about what tables were accessed in an SQL query or DML statement.
Getting to the bottom of who accessed a table or any other objects is not straightforward.
We tried a few things but did not find a good native way to access a table audit log.
As we have learned, the query text itself is stored in various tables, e.g. QUERYTXT in sys_query_history
We tried to cross join STL_QUERY to PG_TABLE, which is an information schema table that lists all the tables of your Redshift instance. However, we ran into other limitations.
One other approach that we did not try is to use the details of the explain plan in STL_SCAN to cross join against the text of the query in STL_QUERY. However, this seems like a bad hack rather than a proper solution
Table and column audit logging in Redshift with FlowHigh
FlowHigh to the rescue. The most straightforward way to accomplish our goal of column and table logging on Redshift is to parse the QUERYTXT from STL_QUERY.
This is easy with the FlowHigh SQL parser.
We used the FlowHigh SDK to write a bit of code to scan the Redshift query history in STL_QUERY and parse out any tables and columns that are part of the queries recorded in QUERYTXT.
You can try it out yourself and register for the FlowHigh.