Geo and location analytics in action with OpenStreetMap and census data
Geo and location analytics in action with OpenStreetMap and census data
In this blog post we integrate and analyse OpenStreetMap, Census, and Geo Data from Ireland. We will use Flexter to convert the data to a Snowflake database. Flexter is a data warehouse automation solution for XML, JSON, CSV, and relational databases. It converts these data sets to CSV, ORC, Parquet, Avro, and various relational databases.
Inside Snowflake we will apply various transformations such as geo point lookups to the data using SQL and Python.
We also show the types of analysis you can perform on the data, e.g. identifying clusters of similar geographical regions in Ireland and Dublin.
In part two of the series we will show you how we have made this data available for free on various data exchanges and how you can use it in your own analysis.
Geo Data sources
We have selected three data sources for this demonstration. All of the data sources are available under the Creative Commons Attribution 4.0 license
OpenStreetMap (OSM)
We downloaded the OpenStreetMap data for Ireland from Geofabrik.
We then used Flexter to convert the XML files to a Snowflake database.

OSM is licensed under the Open Data Commons Open Database License
2016 Census Data Ireland
We downloaded the data for the 2016 census in Ireland. This data is aggregated at different levels of granularity. We selected the data at the lowest level of granularity, which is the Small Area.
The data set is organised by different themes such as Housing, Occupation etc.
The census data is available under the Creative Commons Attribution 4.0 license
Open Geo Data
Our last data source is open data about geographic areas in Ireland. The Republic of Ireland is organised hierarchically into different geographic areas. At the top are the four provinces Ulster, Leinster, Munster, and Connacht. One level below we find the counties and administrative counties. Next the electoral divisions, and then the small areas. There are other geographic areas such as townlands and parishes etc. but for the purpose of our analysis they were a lower priority.
We downloaded the data in Keyhole Markup Language (KML) format, which is a type of XML.
Loading the data sets to a database with Flexter
Loading OpenStreetMap data
We used Flexter to convert the XML files to a relational database (Snowflake).
Data model and core tables
This resulted in the following set of tables
OSM
This is the root table. It contains some basic information and some metadata, e.g. where we loaded the file from.
Note that Flexter generated a globally unique primary key.
Node
A node is one the three core objects in OpenStreetMap. It consists of a single point in space defined by its latitude, longitude and node id.
You can view a node on OpenStreetMap by using its ID in a URL https://www.openstreetmap.org/node/<node ID>. Let’s take ID 385667 as an example https://www.openstreetmap.org/node/385667 :
OSM_NODE_TAG
Each node may have one or many attributes aka tags. Tags for a node are stored as key / value pairs in table OSM_NODE_TAG.
WAY
Another core element is a way. A way is an ordered list of nodes which normally also has at least one tag or is included within a relation.
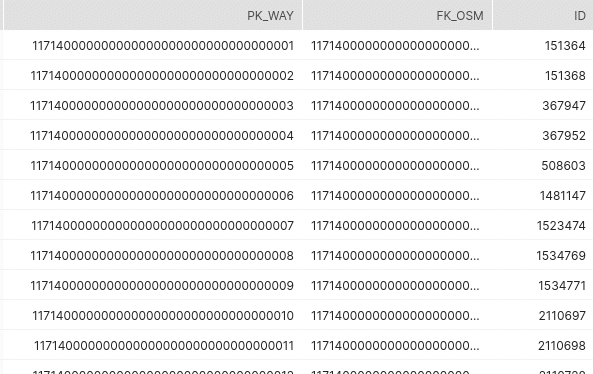
The business key for a way is called an ID.
OSM_WAY_TAG
Way can also have multiple tags organised as key value pairs.
ND
Table ND contains the nodes that make up a way. It contains the ID of the node in column REF.
You can join table ND to Node by ND.REF = NODE.ID
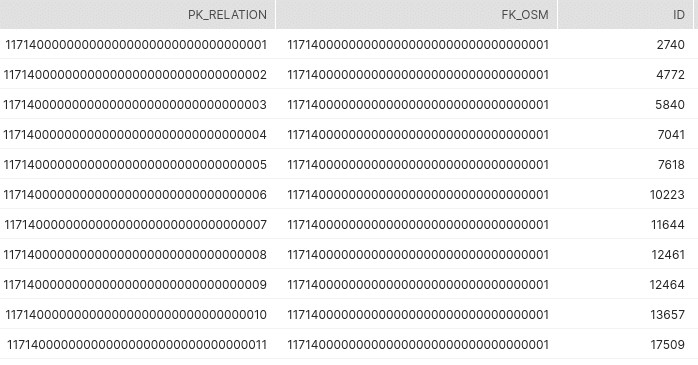
RELATION
A relation is another core concept in OpenStreetMap. It is the most complex concept. A relation is a group of elements. To be more precise it is one of the core data elements that consists of one or more tags and also an ordered list of one or more nodes, ways and/or relations as members which is used to define logical or geographic relationships between other elements. A member of a relation can optionally have a role which describes the part that a particular feature plays within a relation.
MEMBER
The member table contains the elements that are referenced by a relation, i.e. a node, a way, or another relation. The relationship is potentially recursive as a relation can be made up of a relation itself and so on
A role is an optional textual field describing the function of a member of the relation. For example, in North America, east indicates that a way would be posted as East on the directional plate of a route numbering shield. Or, multipolygon relation, inner and outer are used to specify whether a way forms the inner or outer part of that polygon.
OSM_RELATION_TAG
This table contains relation attributes as key / value pairs
One of the more important keys is type, e.g. in the screenshot above with the value “route”
Loading census data
Next we loaded the census data with the Flexter merge2er module. This module can load text files such as CSV, TSV into a database and auto detect the data types.
The census data contains the ID of the small area and various metrics, e.g. the age of the population. The column names are abbreviated and the full text can be found in a glossary.
We replaced the abbreviations with their full names before we used Flexter to load the data into Snowflake.
We used the following Flexter command to load the data:
|
1 |
merge2er --has-header true saps/SAPS2016_SA2017.csv -o "jdbc:snowflake:<your snowflake address>.snowflakecomputing.com/?db=<>&warehouse=<>&schema=SAPS" -u <> -p "<>" |
And this is the result we got in Snowflake
Loading open geo data for Ireland
In the last step we loaded the various geographical areas in Ireland with Flexter.
Some concepts explained
All of the files are based on the KML schema and they have a similar structure. Before we look at the structure in more detail let’s clarify a couple of concepts.
Polygon
A Polygon is a planar Surface defined by 1 exterior boundary and 0 or more interior boundaries. Each interior boundary defines a hole in the Polygon.
Let’s illustrate the point by giving some examples from the small areas data.
A simple polygon with an outer boundary
Let’s visualise it on a map
Let’s have a look at a polygon with an outer and inner boundary. This particular example has two inner boundaries.
Multi-polygon
A MultiPolygon is a MultiSurface whose elements are Polygons.
Let’s have a look at an example from the small areas data. In his particular scenario our multi-polygon is made up of 15 individual polygons. We have visualised some of these polygons.
In the figure above you see two polygons.
Here are two more
And another two
Structure of small areas
We used Flexter, our data warehouse automation solution for XML and JSON to process the KML files to a Snowflake database. This is the command we ran:
|
1 |
xml2er --master local[*] -x 5726 -S o -o "jdbc:snowflake://******.****.snowflakecomputing.com/?db=***&warehouse=***&schema=SMALL_AREAS" -u <user> -p "<password>" -k MDS --mem 8G --byte-stream <path to KML file> |
Flexter generated the following target schema:
Let’s have a look at the tables in more detail:
KML
This is the root table and contains some metadata, e.g. the filename we loaded and the path of the file etc.
As you can see, Flexter generated a globally unique primary key for this table.
PLACEMARK
The PLACEMARK table contains polygons with one outer boundary and zero or more inner boundaries.
As you can see, Flexter generated a foreign key to the KML table (FK_KML). This is a globally unique key.
INNERBOUNDARYIS
If the polygon also contains holes (inner boundaries) then these are stored in table INNERBOUNDARYIS
POLYGON
Multi-polygons are stored in table POLYGON.
SIMPLEDATA
This table contains information about the small area as key / value pairs.
We pivoted the information to make it more readable and easier to join. Key / value tables are a common feature in XML based schemas. We ship scripts with Flexter that can dynamically pivot any key / value based tables to proper relational table structures.
Transforming the OpenStreetMap data
All of the tags for nodes in OpenStreetMap are provided as key / value pairs in OSM_NODE_TAG. On the one hand this gives us a lot of flexibility when creating new tags. On the other hand though it is the source of a lot of data quality issues and poor standardization across nodes. Core concepts are categorised on OpenStreetMap and go through some sort of approval process by the community. One popular and approved category is amenity. There are many different types of amenities, e.g. pubs, post offices, petrol stations etc.
Here is an example for an amenity of type restaurant.
While it is convenient to load data as key / value pairs it is painful to query this data. Hence we have pivoted that information and turned the row values into columns:
We selected the top 20 most popular attributes for amenities during the pivot operation.
We then created a script to look up the amenity nodes against the small area polygons. Et voilá, we have matched the node data against the small area and now can run simple SQL queries across OpenStreetMap data, Irish census data, and administrative boundary data across Ireland.
Analysing the data
We have loaded the data into a Snowflake database. We can now easily analyse the data with simple SQL and create reports and dashboards.
Here is an example:
What is the small area with the highest number of people living in a house or bungalow?
As you can see, this is the small area 267027016/02 in electoral division Blanchardstown-Abbotstown with 601 people living in a house or bungalow.
Let’s have a look what this looks like for the electoral divisions as a whole.
And here is the result
Let’s see what amenities we have in Blanchardstown-Blakestown according to OSM?
We could now calculate the number of doctors per person for each small area and other useful types of analysis such as the size in square metres of each small area.
There is more…
Here are some other ideas of what you can do with this data:
You could run some unsupervised machine learning algorithms to cluster the data to identify small areas that are similar to each other. Maybe you run a successful business in one small area and want to identify other small areas that are similar. If you need help with this type of analysis contact us.
Maybe you want to enrich the data further with other data sets. These could be your own data sets or other publicly available data sets, e.g. we could help you to add Irish property sales data from the last few years. We could add OpenStreetMap data for all of Ireland and not just Dublin. Talk to us about your use case.
Maybe you want to compare the data in Ireland to another country. We can convert the OpenStreetMap data from other countries to Snowflake or another database of your choice.
Conclusion
In this blog post we have demonstrated how you can easily work with complex geographical data sets with the right tools such as Flexter, our data warehouse automation solution to convert complex XML and JSON to a database, text, ORC, Parquet, or Avro.
Are you looking to integrate geo data from other locations or geographical areas? Make sure to reach out to our professional services team.
Why did we create Flexter?
Flexter was born from our own frustration of converting XML and JSON documents into a data warehouse. We saw many projects fail or run over budget. Why waste weeks of converting XML/JSON and risking failure instead of focusing on delivering real value to your business users? We think that the time spent writing manual code to convert the data to It just takes too much time of converting the data
Our customers are delighted with Flexter. Hear what they say
“This will save us weeks”
“You did in one day what we could not achieve in 3 years”
And this is what Ralph Kimball, one of the fathers of data warehousing has to say about XML conversion:
“The construction of an XML parser is a project in itself – not to be attempted by the data warehouse team”. Ralph Kimball, ETL Toolkit
We provide Enterprise Flexter:
Our enterprise edition can be installed on a single node or for very large volumes of XML on a cluster of servers.
If you have any questions please refer to the Flexter FAQ section. You can also request a demo of Flexter or reach out to us directly.
Last but not least we have open sourced Paranoid, our solution to obfuscate data in XML and JSON documents
Who uses Flexter?
Companies in travel, finance, healthcare, automotive, finance, and insurance industry use Flexter.